Working With Hazeltest

In its current state, Hazeltest can automate the process of generating load in the maps of a Hazelcast cluster. By means of a simple, three-scenario example, this blog post demonstrates how Hazeltest and its configuration options can be used for this purpose with the goal of finding weaknesses in the given Hazelcast map configurations.
What is this Hazeltest you’ve recently talked about and how can I make use of it even in this very early stage of development? Which configuration options do I need to tweak in order to configure the two map-related runners the application offers? And: How does all this help identify incorrect or incomplete Hazelcast map configurations?
Look no further, fellow Hazelcast warrior, as the following sections will satisfy your thirst for answers. Get yourself a fresh mug of coffee and follow me on this short walk down Hazeltest map testing alley!
Introduction
Let’s kick this off with a short recap: The underlying challenge that gave birth to Hazeltest was that in scope of the project I currently work in I need to test Helm charts describing Hazelcast clusters for correctness in terms of the setup and configuration they define for the Hazelcast cluster to be deployed to Kubernetes. Those Helm charts represent the release candidates that will eventually be rolled out to production, given they make it through the testing process. Hazeltest does not analyze the Helm chart itself; instead, its goal is to put different kinds of load on the Hazelcast cluster resulting from those charts in order to help discover errors or misconfigurations. The following sections will introduce you to an example of how this works – in the context of three simple scenarios, we’re going to use Hazeltest in order to find weaknesses in the Hazelcast map configuration each scenario provides.
Configuring Map Usage Behavior
Because we’re going to make good use later on of the map behavior configuration options Hazeltest provides, it’s probably a good idea to introduce them now before we get started with the first scenario.
I mentioned flexibility in configuring the number of maps used by Hazeltest as one of the features the application should have. The underlying idea for how to make this happen in the application is very simple: By appending various identifiers to the map name (or omitting the identifiers), the number of maps Hazeltest will create and use in the Hazelcast cluster can be drastically increased (or decreased). At the time of writing this, there are two identifiers available to be appended to the map name: The unique ID of the Hazeltest instance creating the maps on Hazelcast, and the index of the map goroutine performing actions on a map.
Let’s see how this works using a simple example. Take a look at the following excerpt from the Hazeltest values.yaml file we’re going to use in scope of scenario 1 (lines not relevant in this context omitted for brevity):
replicaCount: 1
# ...

config:
  maptests:
    pokedex:
      enabled: false
      # ...
    load:
      enabled: true
      numMaps: 10
      appendMapIndexToMapName: true
      appendClientIdToMapName: false
      # ...
In this configuration, the PokedexRunner is deactivated, so we can ignore its map settings. The LoadRunner, on the other hand, is enabled and configured to spawn ten map goroutines. Because appendMapIndexToMapName is set to true, those ten goroutines will correspond to ten maps in Hazelcast since the runner will append the index of each goroutine to the map name (conversely, if this setting were false, even though the runner would still launch ten map goroutines, they would all be accessing the same map, so this would translate to only one map in the cluster). Meanwhile, appendClientIdToMapName is false, meaning the runners of this Hazeltest instance will not append this instance’s unique ID to the maps they use, so even if we had more than one Hazeltest instance running with the above configuration, the number of maps created in the Hazelcast cluster would still be ten as all instances would work with the same map names. On the other hand, if appendClientIdToMapName were set to true, each runner in each Hazeltest instance would work on its own batch of maps, thus significantly increasing the number of maps. In summary, with a replicaCount of 1 and only one runner active, the above configuration will create ten maps in the Hazelcast cluster.
Let’s see how we can drastically increase this number by tinkering around a bit with those properties (what you see below is an excerpt of the Hazeltest configuration you’re going to use in scope of scenario 2):
replicaCount: 40
# ...

config:
  maptests:
    pokedex:
      enabled: true
      numMaps: 5
      appendMapIndexToMapName: true
      appendClientIdToMapName: true
      # ...
    load:
      enabled: true
      numMaps: 10
      appendMapIndexToMapName: true
      appendClientIdToMapName: true
      # ...
The most apparent change is that the number of replicas is much higher, but if the above configuration were identical to the scenario 1 configuration apart from the replicaCount value, it would still give us very few maps (5 for the PokedexRunner and 10 for the LoadRunner). The trick is that this time, appendClientIdToMapName is true for both runners, so each runner in each Hazeltest instance will work on its very own batch of maps. The number of maps in each batch is controlled by the numMaps property. So, the above configuration gives us the following map counts:
PokedexRunner: 40 instances * five maps each –> 200 mapsLoadRunner: 40 instances * ten maps each –> 400 maps
With a total of 600 maps, the load those Hazeltest instances will put on the Hazelcast cluster is quite a lot higher compared to the scenario 1 configuration. Thus, simply playing around with the number of Hazeltest instances, the number of maps used for each runner, and the two append* properties yields vastly different results in terms of the map usage on the Hazelcast cluster those instances work with.
With this bit of theory out of the way, let’s finally satisfy that itch in our fingers and get started!
Scenario 1
The way the following scenarios are set up is that in each one, we’re going to use Helm to create a Hazelcast cluster with a specific map configuration, which we’re then going to throw some load against using Hazeltest, also in various configurations, in order to test the stability of the Hazelcast cluster and, hence, the correctness and completeness of its map configurations.
Our Hazelcast map configuration for the first scenario is very modest in its size (see here for the full values.yaml file):
map:
  # Default configuration is pretty restrictive to protect cluster from misbehaving client applications
  default:
    backup-count: 0
    # Map entries will be expired after 5 seconds of inactivity (neither read nor write)
    max-idle-seconds: 5
    in-memory-format: BINARY
  # Assumption: A client application uses maps starting with 'ht_'
  ht_*:
    backup-count: 1
    # Keep entries around for ten minutes
    max-idle-seconds: 600
    in-memory-format: BINARY
There is nothing exactly wrong with this map configuration, it just seems a bit… plain. Something seems to be missing, and in the next step, we’re going to find out what.
(From this point onwards, if you would like to follow along, you’ll need a Kubernetes cluster with a bit of juice at your disposal – in case you don’t have one, please refer to this list of options to get started.)
First, clone the Hazeltest source code repository and navigate to the resources/charts directory, where you’ll find Helm charts both for Hazelcast and Hazeltest (the following Helm commands will assume you are operating from this directory). In each scenario, you only need to replace the contents of the values.yaml files on disk with the contents of those you can find beneath this repository directory. So, for the first scenario, use the contents of the following files:
- Hazelcast: scenario_1/hazelcast/values.yaml
- Hazeltest: scenario_1/hazeltest/values.yaml
As soon as you have your file contents set up correctly, deploy the Hazelcast cluster using the following command:
$ helm upgrade --install hazelcastwithmancenter ./hazelcastwithmancenter --namespace=hazelcastplatform --create-namespace
Very conveniently – and as you probably guessed from the Helm chart’s name – , this also deploys an instance of the Hazelcast Management Center (“Mancenter”) that we can use to view our maiden Hazelcast cluster. The RKE cluster I currently use is not yet able to provision an external IP for a LoadBalancer Service or an Ingress object, so to expose the Mancenter Pod, I had to resort to a NodePort Service (if your cluster supports LoadBalancer Services, of course feel free to head over to the Hazelcast Helm chart and adjust it accordingly). Thus, to view the Mancenter, we need the IP of any of the Kubernetes nodes (or the host name, in case you have made it known to your DNS) plus the port Kubernetes assigned to the NodePort Service:
# Query worker IP and host name
$ k get node -o jsonpath="{.items[0].status.addresses[*].address}"
192.168.8.119 kube-1

# Query port given to 'NodePort' Service
$ k -n hazelcastplatform get svc hazelcastimdg-mancenter -o jsonpath="{.spec.ports[0].nodePort}"
31527
In the meantime, your Pods might have become ready:
$ watch kubectl -n hazelcastplatform get pod
NAME                                      READY   STATUS    RESTARTS   AGE
hazelcastimdg-0                           1/1     Running   0          2m6s
hazelcastimdg-1                           1/1     Running   0          85s
hazelcastimdg-2                           1/1     Running   0          45s
hazelcastimdg-mancenter-dffb594bf-gnz5b   1/1     Running   0          2m6s
Once the Mancenter Pod has achieved readiness, you can bring up the Mancenter’s web UI using the previously retrieved combination of IP or host name and port. If all three Hazelcast Pods have already come up, your screen should look roughly like this:
Because this looks very suspiciously like a Hazelcast cluster pretty much idling, we’ll generate some load in the next step. Using the Hazeltest configuration file for scenario 1 – which you’ve already met earlier on – in Hazeltest’s Helm chart will give us one Hazeltest instance with the LoadRunner activated, and because the LoadRunner is configured to utilize only ten maps, the focus of this configuration is really just to congest the cluster’s memory. Let’s deploy Hazeltest:
$ helm upgrade --install hazeltest ./hazeltest --namespace=hazelcastplatform
The Hazeltest Pod should start almost instantaneously:
$ watch kubectl -n hazelcastplatform get pod
NAME                                      READY   STATUS    RESTARTS   AGE
hazelcastimdg-0                           1/1     Running   0          6m9s
hazelcastimdg-1                           1/1     Running   0          5m29s
hazelcastimdg-2                           1/1     Running   0          4m49s
hazelcastimdg-mancenter-dffb594bf-gnz5b   1/1     Running   0          6m9s
hazeltest-688bcd7d7-5h8fz                 1/1     Running   0          2s
A quick check on the Hazeltest logs should confirm the application was able to connect to the Hazelcast cluster and the LoadRunner has successfully started:
# As always... (the 'watch' command won't catch this, though)
$ alias k=kubectl

$ k -n hazelcastplatform logs hazeltest-688bcd7d7-5h8fz
# ...
2022/06/03 14:00:57 INFO : trying to connect to cluster: hazelcastplatform
2022/06/03 14:00:57 INFO : connected to cluster: hazelcastplatform
2022/06/03 14:00:57 INFO :

Members {size:3, ver:3} [
	Member 10.42.0.164:5701 - d69d50d2-d417-4b93-a7ee-e6c8b6d2a209
	Member 10.42.1.189:5701 - d0e6371d-3233-461b-affb-43394eecc365
	Member 10.42.2.31:5701 - 2990430d-0fe2-463a-848b-3960bee9df39
]
# ...
{"client":"4f61ca1d-e583-415c-8f9a-ecb8e5063b99","file":"/app/maps/testloop.go:279","func":"hazeltest/maps.logInternalStateEvent","kind":"internal state info","level":"info","msg":"using map name 'ht_load-5' in map goroutine 5","time":"2022-06-03T14:00:57Z"}
# ...
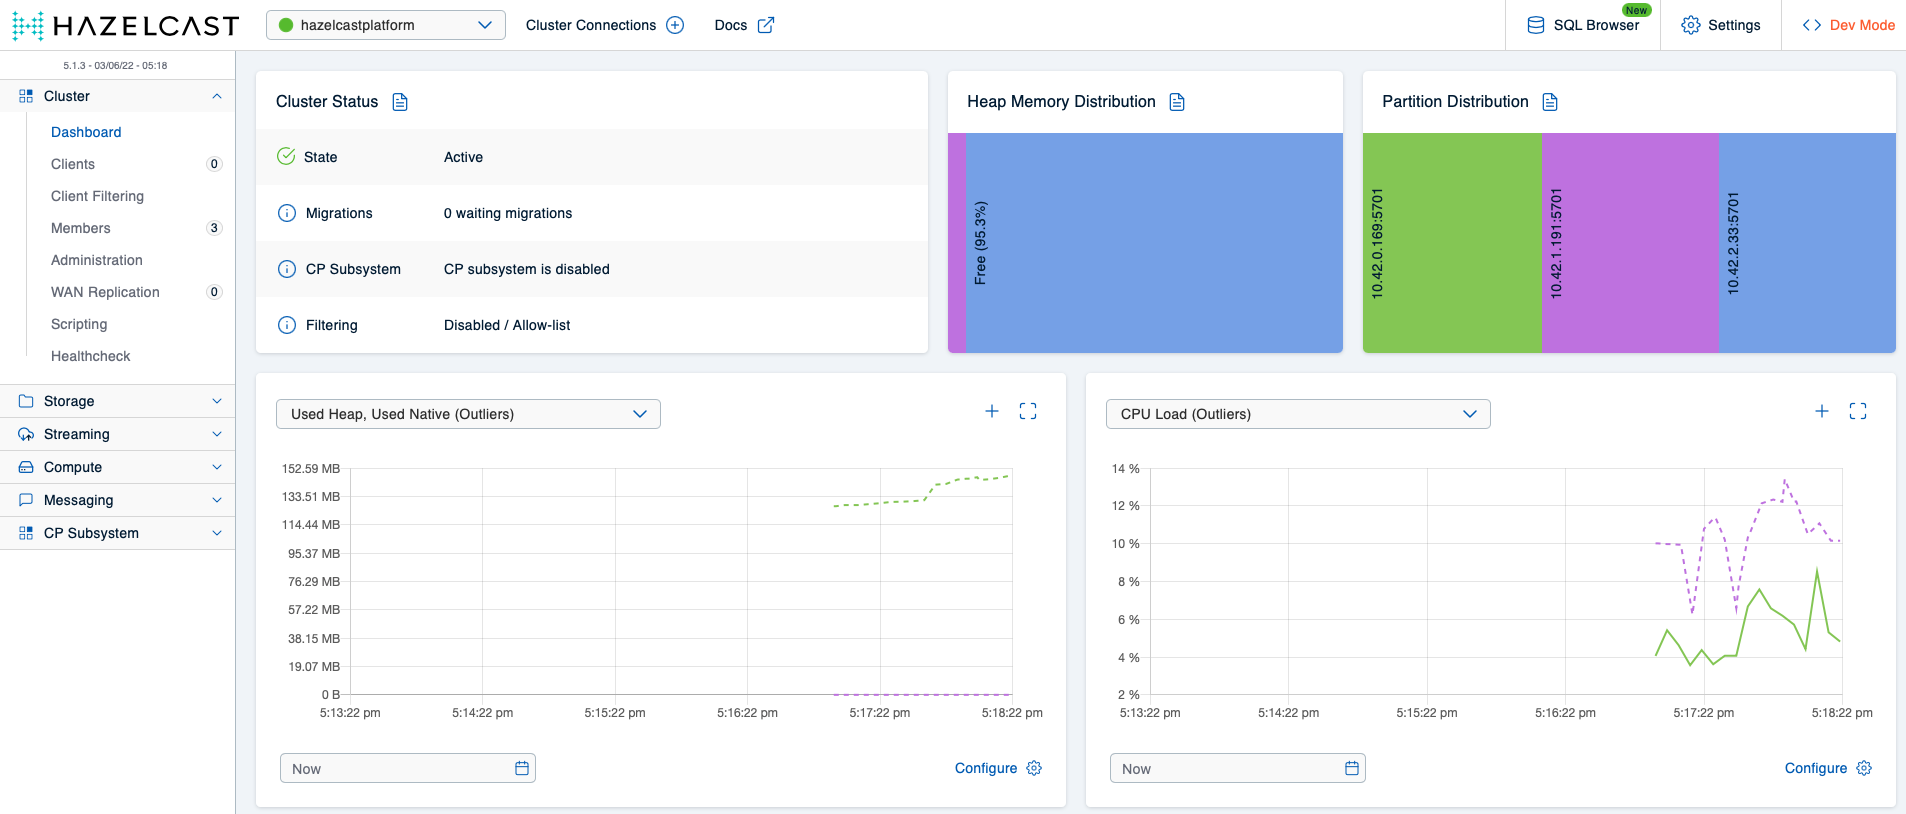
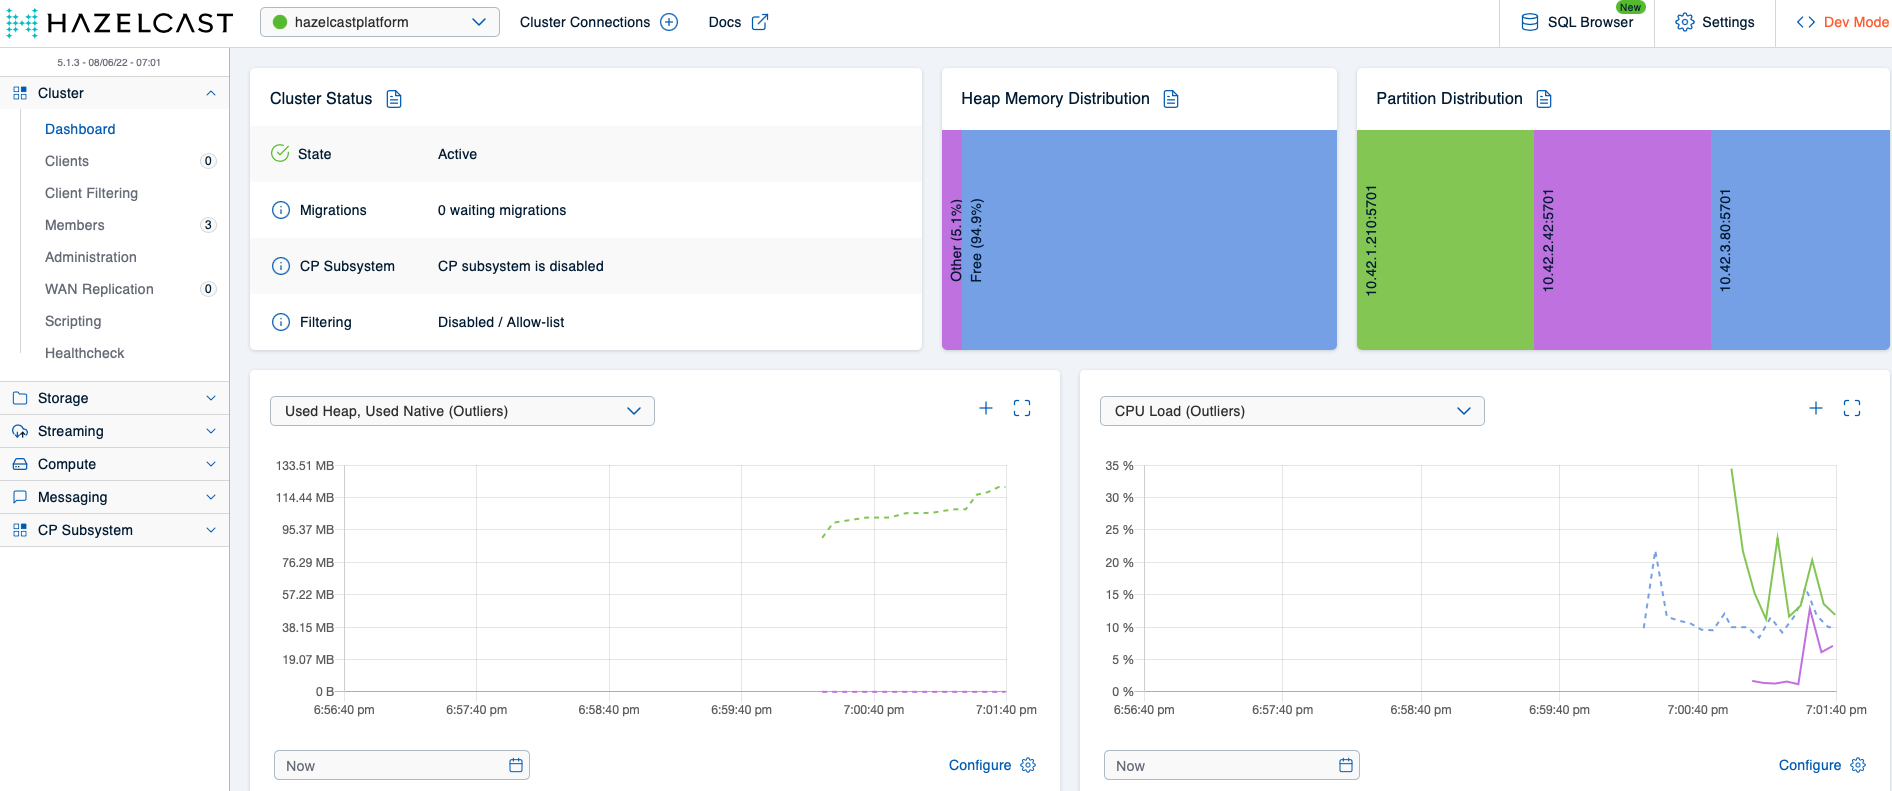
In case what you’re seeing on your terminal looks similar to the above, you’re all set. With Hazeltest now writing to some maps, let’s head to the Mancenter once more and observe how the cluster’s memory starts filling up:
Right now, the members’ heap usage is still comfortable:
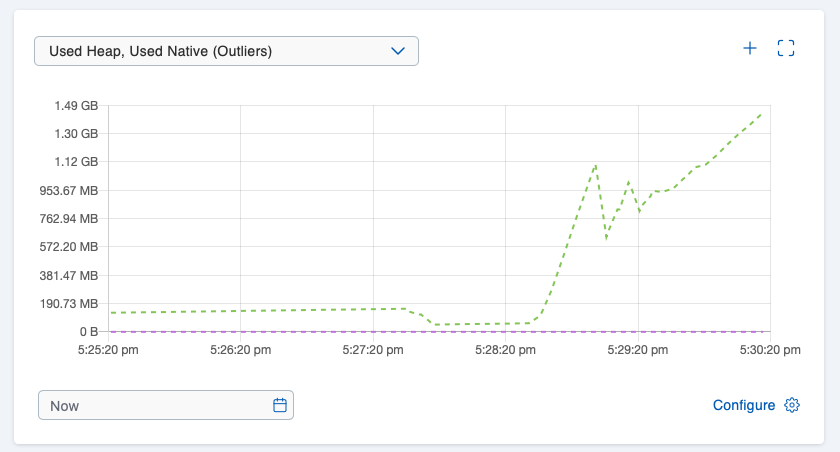
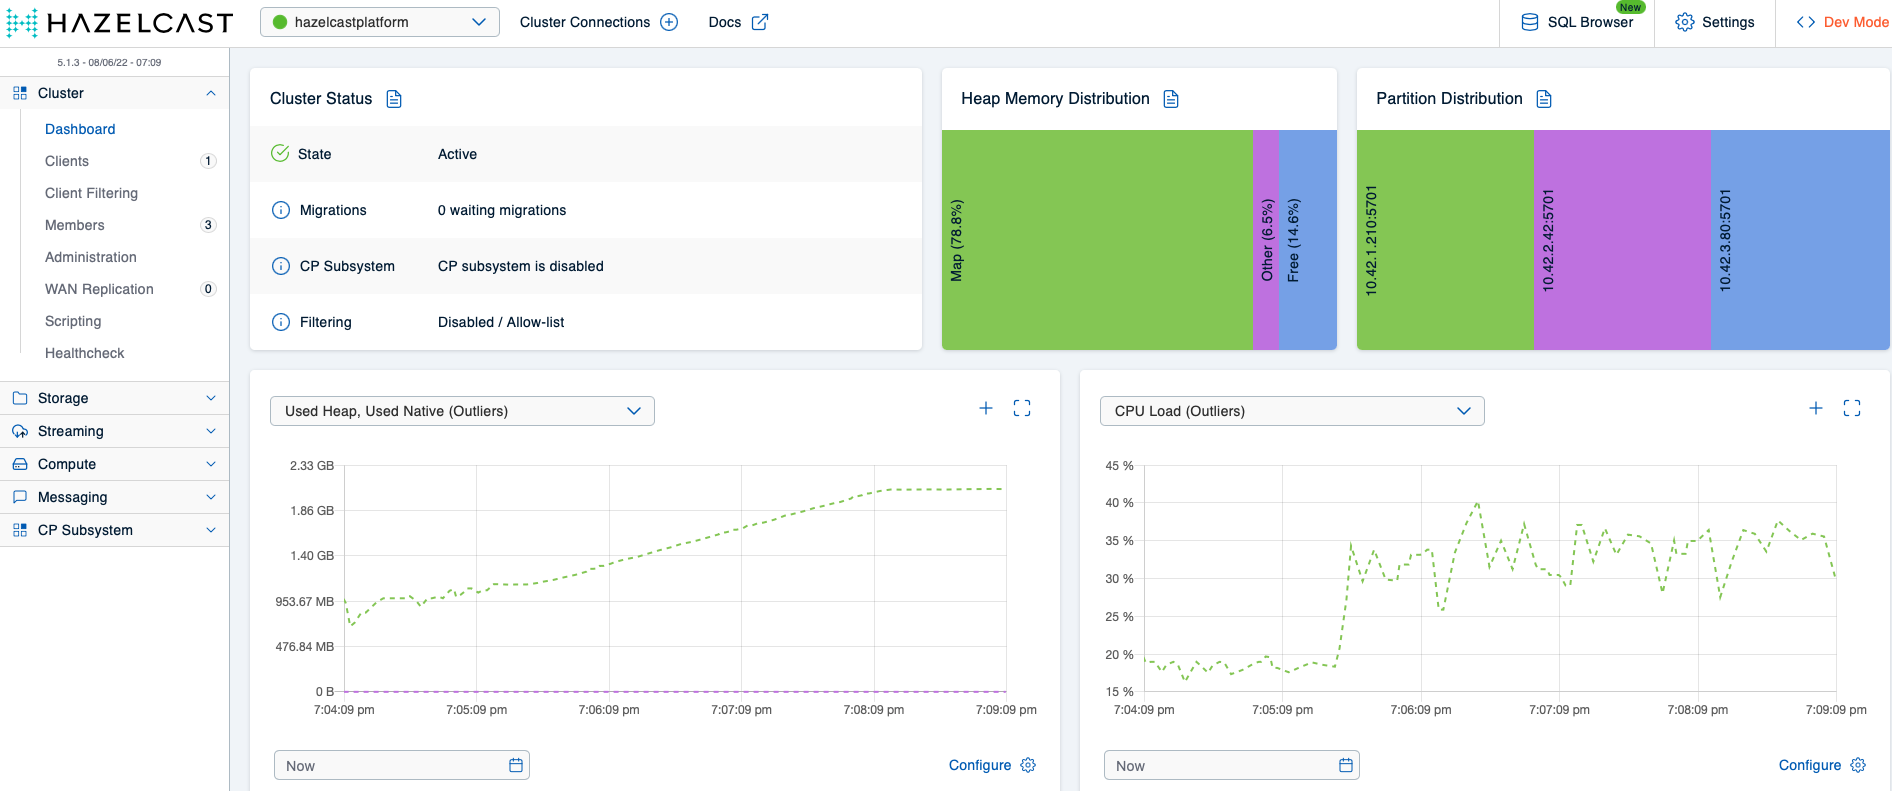
We’re getting closer to the piece missing in the Hazelcast map configuration for scenario 1, and you might have guessed what it is: The max-idle-time property configures an expiration policy for the ht_ map pattern making sure an entry will expire after no application has touched it (read or write) for a set amount of seconds, but if an application ingests data so quickly the expiration policy never has a chance to kick in to begin with, the memory will just keep filling up. So, what we’re missing is an eviction policy for the map pattern in question. The effects of not having defined one can be seen in our cluster only a couple of moments later:
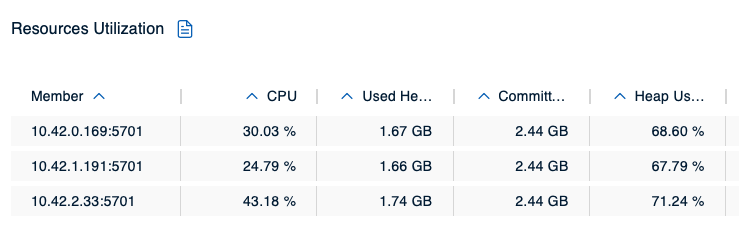
The members’ heap usage is already critical, but since the Hazeltest instance is still hammering on the cluster with yet more data, the inevitable happens and the cluster incurs member crashes:
$ watch kubectl -n hazelcastplatform get pod
NAME                                      READY   STATUS    RESTARTS     AGE
hazelcastimdg-0                           0/1     Running   1 (8s ago)   19m
hazelcastimdg-1                           1/1     Running   0            18m
hazelcastimdg-2                           0/1     Running   0            17m
hazelcastimdg-mancenter-dffb594bf-gnz5b   1/1     Running   0            19m
hazeltest-688bcd7d7-5h8fz                 1/1     Running   0            3m44s
At this point, it’s no surprise we find OutOfMemoryErrors in the members’ logs:
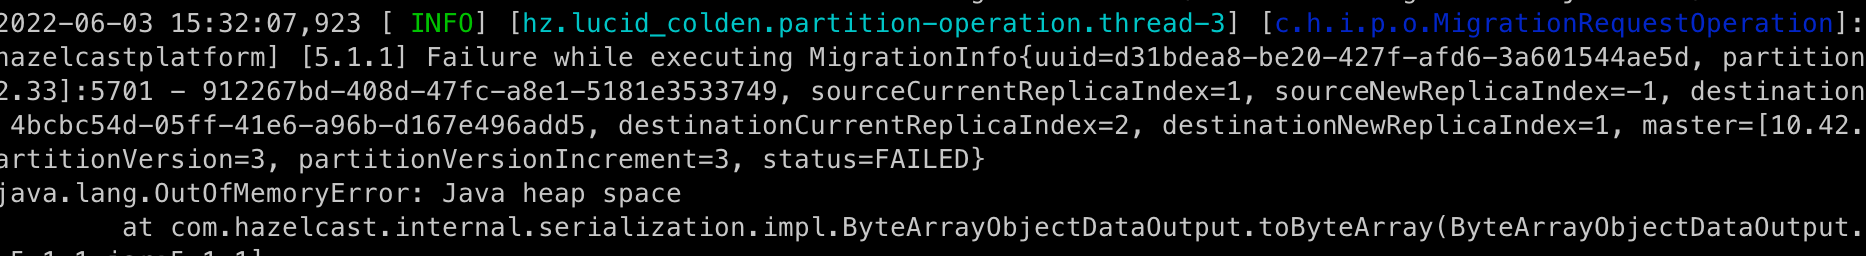
To conclude the obvious: The scenario 1 Hazelcast map configuration does not result in a stable cluster. Surely, we can do much better than that! Before attempting this, though, let’s clean up the mess and create a clean slate for scenario 2:
# Uninstall Hazeltest
$ helm uninstall hazeltest --namespace=hazelcastplatform

# Uninstall Hazelcast
$ helm uninstall hazelcastwithmancenter --namespace=hazelcastplatform
Scenario 2
So, as it turns out, defining the ht_ map pattern without an eviction policy is not a particularly great idea. Fortunately, the fix is simple – all we have to do is choose an appropriate eviction policy (the Hazelcast chaps have provided a very nice overview of the available policies along with short explanations over here in their docs) and configure it by providing a value for the size property (excerpt from the Hazelcast values.yaml file you’re going to use in this scenario):
map:
  # Create very restrictive config for all map names not corresponding to one of
  # the other patterns such as to protect cluster from potentially misbehaving client applications
  default:
    backup-count: 0
    max-idle-seconds: 5
    in-memory-format: BINARY
  # Config for the Hazeltest maps
  ht_*:
    backup-count: 1
    # Keep entries around for ten minutes
    max-idle-seconds: 600
    in-memory-format: BINARY
    eviction:
      eviction-policy: LRU
      max-size-policy: FREE_HEAP_PERCENTAGE
      size: 15
I have gone for the FREE_HEAP_PERCENTAGE policy here because it gives us a very straightforward way of making sure we utilize the Hazelcast cluster resources in an efficient way while making sure each member has enough breathing space on its heap – whenever the heap space of a member holding partitions of an ht_ map decreases below 15 %, eviction will kick in and delete values from the map or maps in question. To determine which values are deleted, the LRU policy is used (Least Recently Updated).
Next, we’re going to test this configuration in a short two-stage test: First, we’re going to use the scenario 1 Hazeltest configuration to generate load, and then we’re going to switch to the much more demanding scenario 2 Hazeltest configuration.
Stage 1
In this stage, use the contents of the following values.yaml charts:
- Hazelcast: scenario_2/hazelcast/values.yaml
- Hazeltest: scenario_1/hazeltest/values.yaml (same file as before)
Once the file contents are in place, we can install the Hazelcast cluster, retrieve the NodePort Kubernetes has assigned to the NodePort-type Service fronting the Hazelcast Mancenter Pod, and bring up the Mancenter’s browser UI (you already have the name or a worker IP from the first scenario, so there’s no need to query those again):
# Install Hazelcast and Mancenter
$ helm upgrade --install hazelcastwithmancenter ./hazelcastwithmancenter --namespace=hazelcastplatform

# Query NodePort
$ k -n hazelcastplatform get svc hazelcastimdg-mancenter -o jsonpath="{.spec.ports[0].nodePort}"
32546
Once all Hazelcast Pods have become ready, the Mancenter view should be very similar to what you’ve seen in scope of scenario 1:
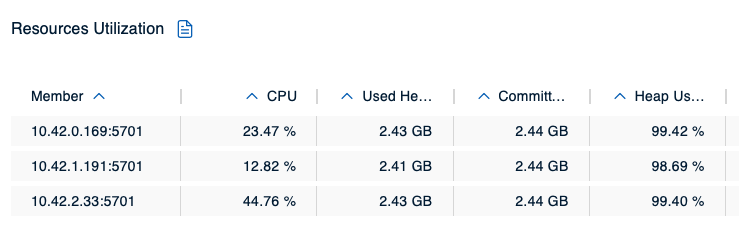
Deploying Hazeltest with the previous scenario 1 configuration (helm upgrade --install hazeltest ./hazeltest --namespace=hazelcastplatform) should again give us some nice load on the cluster, which you can observe in the Mancenter. This time around, though, because the Hazeltest instance writes to ht_ maps and because we have a reasonable eviction policy in place for that map pattern, we can expect the memory usage to not increase further once the members have reached roughly 85 % of heap usage. And indeed, the Mancenter view confirms this expectation:
So, with the eviction policy in place, the Hazelcast cluster remains stable even as Hazeltest keeps ingesting more data as old data gets evicted. Let’s amp up our game, then, and give the cluster some more load to chew on!
Stage 2
For this stage, you’ll want to have the following values.yaml files in place in your local Hazelcast and Hazeltest charts:
- Hazelcast: scenario_2/hazelcast/values.yaml (same file as before)
- Hazeltest: scenario_2/hazeltest/values.yaml
First, to create a clean slate for this scenario, scale down the Hazelcast StatefulSet to zero and then back up to three again, which will wipe all data from the cluster (you might instead uninstall and reinstall the Helm release, but that would entail querying the NodePort again):
# Scale down StatefulSet (kill the Pods while they are in 'Terminating' state if you're in a hurry)
$ k -n hazelcastplatform scale statefulset hazelcastimdg --replicas=0
statefulset.apps/hazelcastimdg scaled

# Scale StatefulSet back up again
$ k -n hazelcastplatform scale statefulset hazelcastimdg --replicas=3
statefulset.apps/hazelcastimdg scaled
Next, uninstall the previous Hazeltest release, make sure you have the scenario 2 configuration in place, and install it again:
# Uninstall existing release carrying the scenario 1 configuration
$ helm uninstall hazeltest --namespace=hazelcastplatform

# Install new release using the scenario 2 configuration
$ helm upgrade --install hazeltest ./hazeltest --namespace=hazelcastplatform

# Make sure all 40 replicas have come up
$ k -n hazelcastplatform get deploy --selector="app.kubernetes.io/name=hazeltest"
NAME                      READY   UP-TO-DATE   AVAILABLE   AGE
hazeltest                 40/40   40           40          96s
There should now be 80 client applications connected to your Hazelcast cluster, and the cluster should contain 600 maps (602 if you count in the two system maps Hazelcast uses internally). Let’s give the Hazeltest instances some time to do their work and then view the Mancenter again:
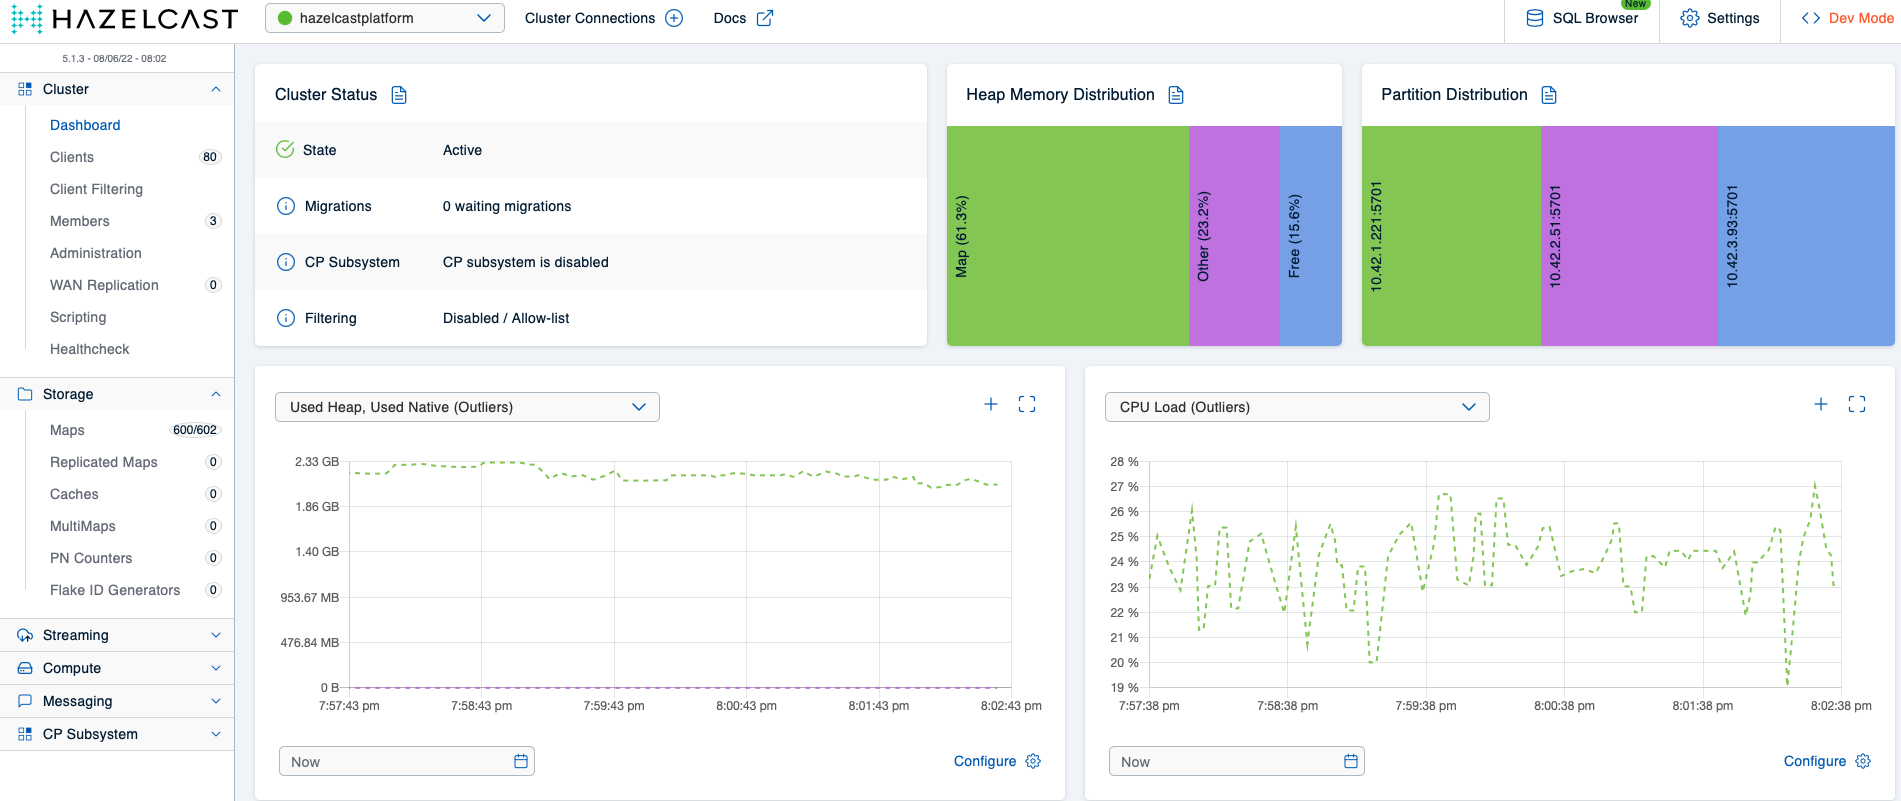
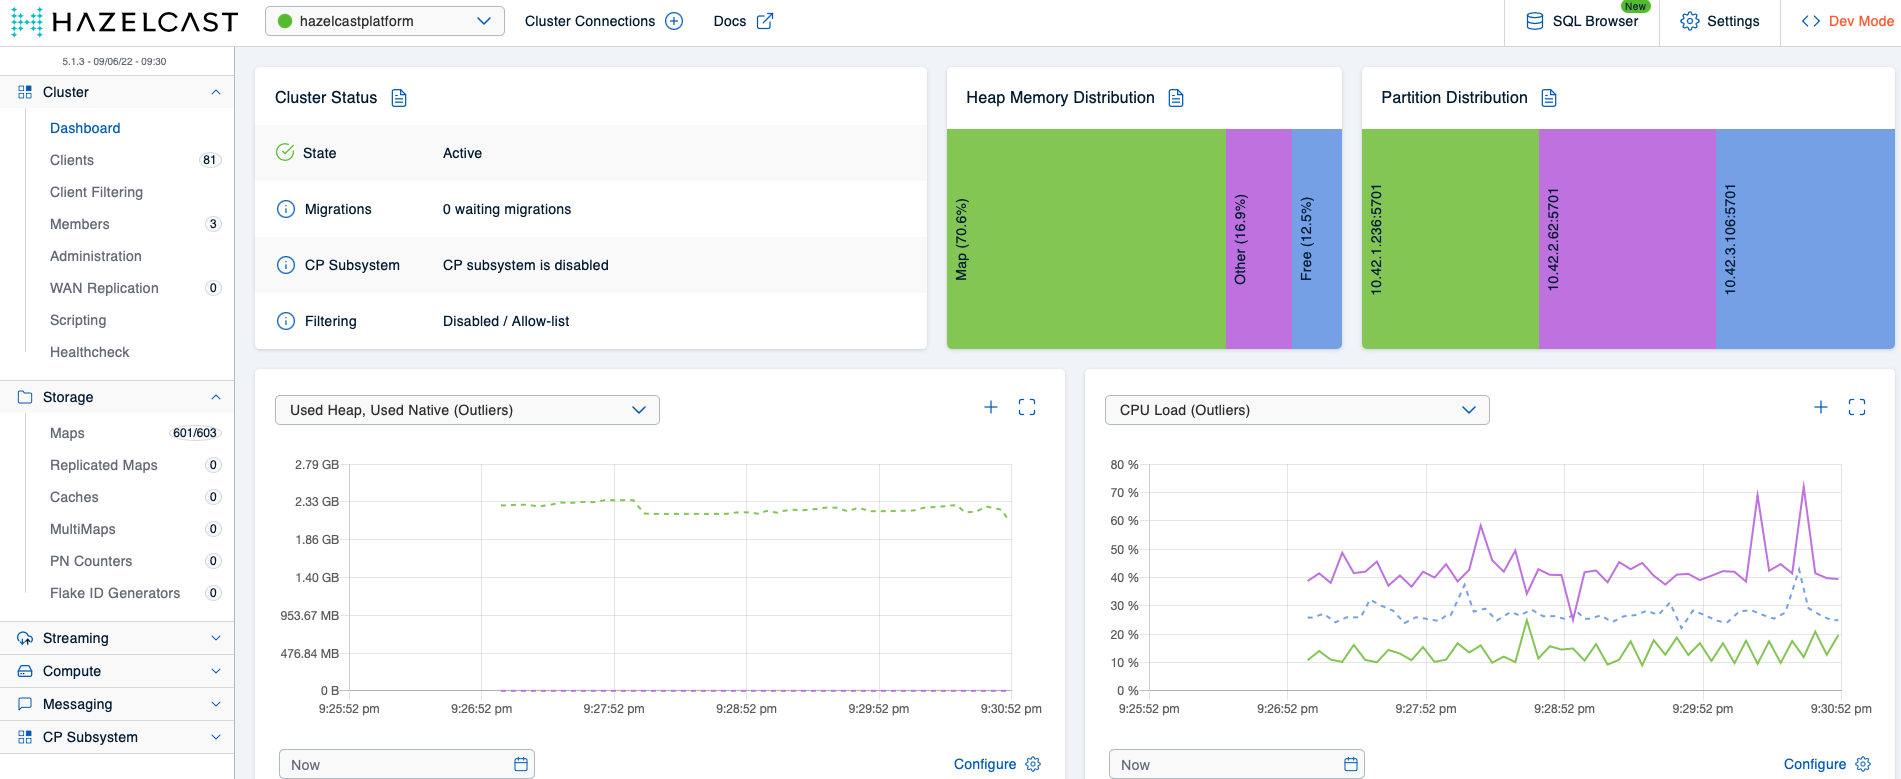
What might have caught your attention here is that the overall storage capacity in the cluster (as in: the amount of memory available for actually storing things) has decreased. You can see this in the Heap Memory Distribution diagram, which indicates the Other section now occupies a significantly higher portion of the heap than previously. This is due to the additional housekeeping Hazelcast has to do to manage the additional client applications and maps – for example, think about all the additional metadata about map entries the cluster now has to keep track of and update, such as the max idle timer on each key. Using off-heap memory is one of the advantages of Hazelcast’s high-density (HD) memory store – it allows one to nicely separate storing the data from all the work the cluster has to do to manage that data and the client applications that act on it (in my current project we use HD memory wherever possible). Understandably, they’ve made this an enterprise-only feature, and because we’re running the community version of Hazelcast in these examples, we can’t make us of it (in case you would like to give it a try, you can request an enterprise trial license here). The key takeaway for stage 2, though, is that the Hazelcast cluster remains stable even with the much higher load the scenario 2 configuration for Hazeltest produces, thus the scenario 2 Hazelcast map configuration is a significant upgrade to its predecessor.
Before we declare this stage done and move on to the next scenario, I would like to put your attention to one tiny, but important detail. In case you’ve taken a look at the logs of one of the Hazeltest Pods, you might have found lines like the following:
{"client":"4f35f84a-3a87-4d55-8247-4b2b98a78e6d","file":"/app/maps/testloop.go:289","func":"hazeltest/maps.logHzEvent","kind":"hazelcast error","level":"warning","msg":"failed to read data from map 'ht_pokedex-3-4f35f84a-3a87-4d55-8247-4b2b98a78e6d' in run 2: value retrieved from hazelcast for key '4f35f84a-3a87-4d55-8247-4b2b98a78e6d-3-1' was nil -- value might have been evicted or expired in hazelcast","time":"2022-06-08T18:39:05Z"}
This line informs us one of the test loops – in relation to the PokedexRunner, in this case – received nil for a particular key it attempted to retrieve from a map starting with the ht_ prefix. This can easily be explained as being simply the effect of the eviction policy for that map pattern: Because the cluster has to evict entries due to the 15 % heap threshold the Hazeltest instances writing more and more data would otherwise exceed and because Hazeltest’s test loop attempts to read all keys it has previously written during each map iteration, we can expect some keys not to be present anymore.
For the next scenario, you don’t need to uninstall the Hazelcast cluster and the Hazeltest instances because we’re going to keep using both in the first stage.
Scenario 3
The previous scenario’s outcome was a map configuration that resulted in a stable Hazelcast cluster – at least as far as writing to the ht_ map pattern was concerned. What we’re going to examine in this final scenario is what happens when a bunch of misbehaving client applications show up to the party not bothering to use our neatly set up ht_ map pattern configuration.
When an application requests a map on the cluster whose name does not match one of the pre-configured patterns, the map will be created with the configuration provided for the default map pattern. In our case, the default map pattern configuration is this (from the scenario 2 values.yaml file):
map:
  # Create very restrictive config for all map names not corresponding to one of
  # the other patterns such as to protect cluster from potentially misbehaving client applications
  default:
    backup-count: 0
    max-idle-seconds: 5
    in-memory-format: BINARY
According to my experiences thus far with Hazelcast in an enterprise environment, internal clients (e. g. a team of developers or their representative) usually have no intention of using the default config since it most likely won’t satisfy the individual needs their applications have. Therefore, if a client application uses a map name no pattern has been explicitly configured for, it’s most likely not the behavior the developers had in mind. This means the default map config should have a rather short time-to-live-seconds or max-idle-seconds value so as to enforce error messages or even crashes in the application in order to make the developers aware something’s wrong as early as possible in their development cycles. In the above configuration, Hazelcast will expire keys not touched for five seconds, which should be short enough to bring the key expiration to the developer’s attention. But is it also short enough to protect the cluster from misbehaving applications?
Stage 1
This stage will build on the state left behind by the previous scenario. You’ll want to use the following values.yaml files:
- Hazelcast: scenario_2/hazelcast/values.yaml (same file as before)
- Hazeltest: scenario_3/hazeltest/values.yaml
The new Hazeltest configuration will launch only three replicas and use only the LoadRunner with the following properties (lines not relevant omitted for brevity):
config:
  maptests:
    # ...
    load:
      enabled: true
      numMaps: 10
      appendMapIndexToMapName: false
      appendClientIdToMapName: false
      mapPrefix:
        enabled: true
        prefix: "xx_"
The ten map goroutines this runner spawns will write to only a single map in Hazelcast (this is so we can observe the effects in the Hazelcast cluster more easily in the Mancenter). More importantly, the map will receive the prefix xx_ – which has not been listed in the cluster’s map configuration. Thus, this map will be subject to the default configuration shown in the previous section.
Without deleting either the Hazelcast cluster or the previous Hazeltest instances, run the following command to install another release of Hazeltest:
$ helm upgrade --install hazeltest-default-map ./hazeltest --namespace=hazelcastplatform
This will yield three Hazeltest instances all writing to a map called xx_load. The expectation with regards to the Hazelcast cluster is that it will still remain stable – after all, the eviction policy on the ht_ map pattern should make sure there’s always enough heap available. The good news is the cluster does indeed remain stable, …
… but there is also a piece of bad news. Take a look at the detail view of the xx_load map:
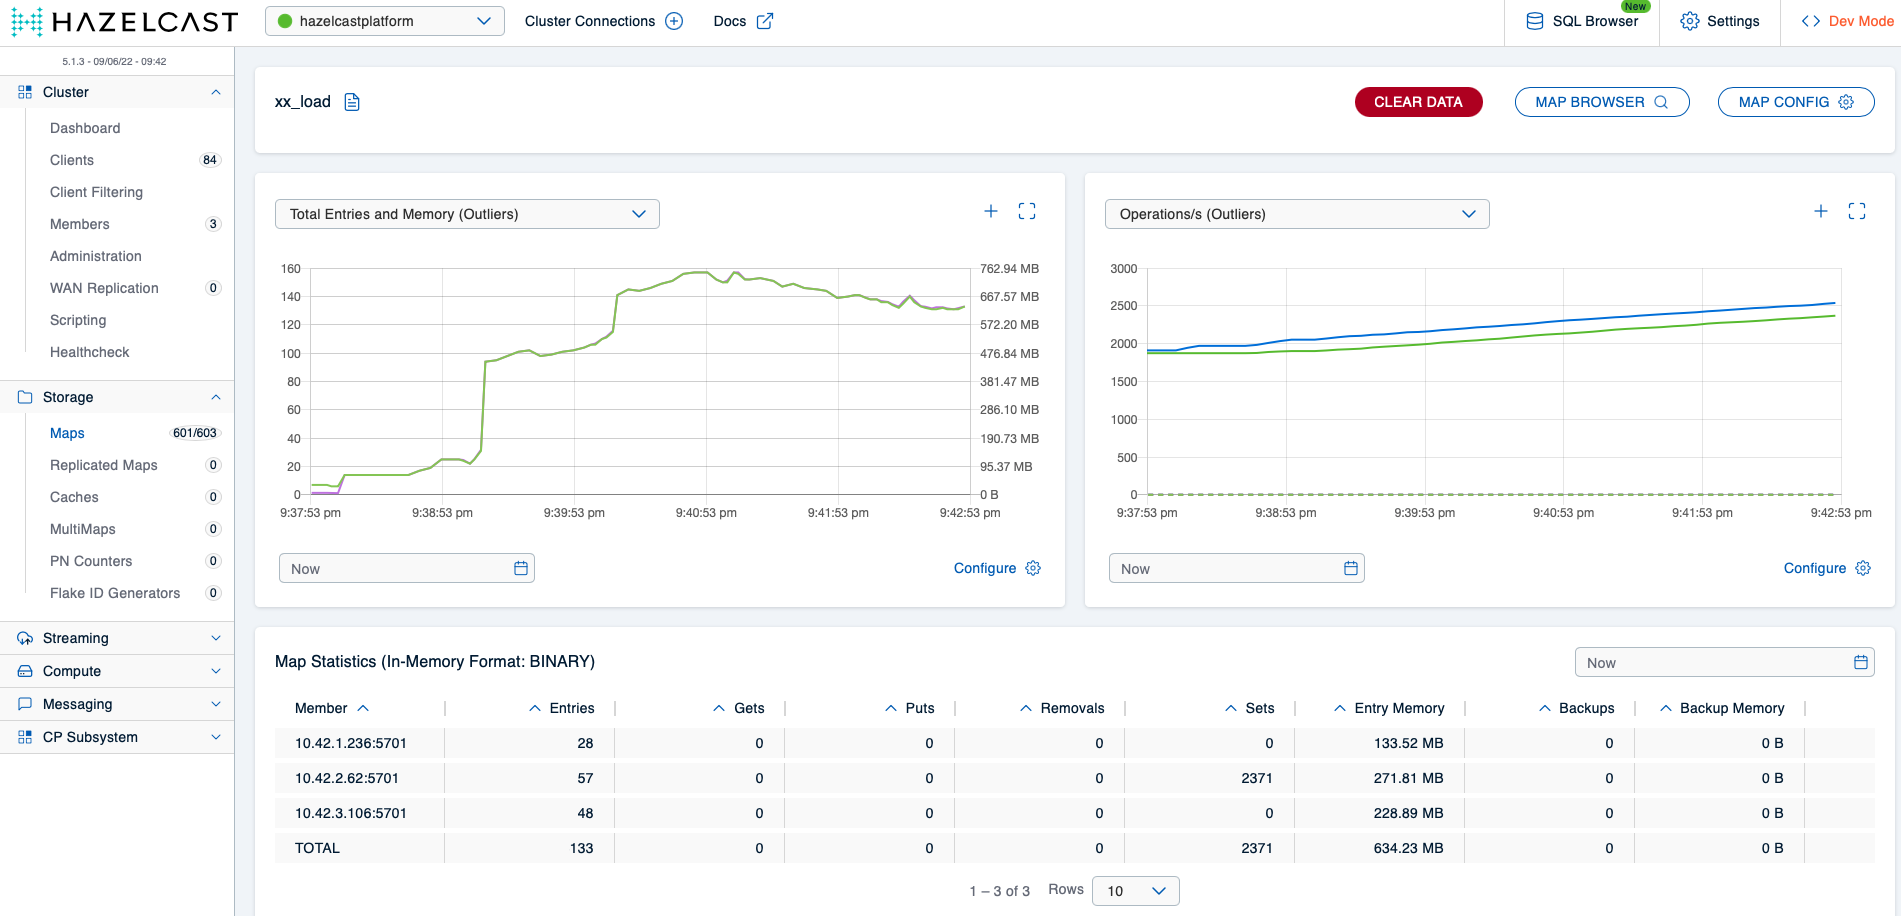
The map takes up almost 700 MBs of storage capacity on the cluster because Hazelcast will evict ht_ map entries to make room for those in the xx_load map. As described before, client applications write to this map most likely as a result of a misconfiguration on their side and probably won’t function correctly anyway due to the short key expiration time, so it makes no sense to keep entries in this map around at the cost of other maps in use by well-behaving applications. Another problem is that once enough applications write to the xx_ map – or any map whose name does not match a pre-configured pattern, for that matter –, the cluster will again run into memory issues.
Let’s fix both problems in scope of stage 2.
Stage 2
Once effective means of collaboration have been put in place between the Hazelcast team and the various teams using it in some way, no application should accidentally use the default map pattern. Still, humans err, and so it’s good practice to make the default map configuration even more restrictive than it already was by defining an eviction policy, and ideally, the policy is configured such that entries in maps subject to the default configuration will always get evicted first. In case of the FREE_HEAP_SPACE policy, this can be achieved simply by providing a size value greater than the value of all other policies. For example (excerpt from the scenario 3 Hazelcast values.yaml file):
map:
  # Create very restrictive config for all map names not corresponding to one of
  # the other patterns such as to protect cluster from potentially misbehaving client applications
  default:
    backup-count: 0
    max-idle-seconds: 5
    in-memory-format: BINARY
    eviction:
      eviction-policy: LRU
      max-size-policy: FREE_HEAP_PERCENTAGE
      size: 50
With this config, Hazelcast’s cluster members will start to evict entries from the partitions related to all maps subject to this configuration once the share of their occupied heap space has exceeded 50 %.
Before applying this config, you’ll first want to uninstall all currently running Hazeltest instances and the Hazelcast cluster like so:
# Uninstall most recent release of Hazeltest
$ helm uninstall hazeltest-default-map --namespace=hazelcastplatform

# Uninstall previous release of Hazeltest
$ helm uninstall hazeltest --namespace=hazelcastplatform

# Uninstall Hazelcast cluster
$ helm uninstall hazelcastwithmancenter --namespace=hazelcastplatform
To run through the second stage, you’ll need the contents of the following values.yaml files:
- Hazelcast: scenario_3/hazelcast/values.yaml
- Hazeltest for creating
ht_maps: scenario_2/hazeltest/values.yaml - Hazeltest for creating
xx_maps: scenario_3/hazeltest/values.yaml
First, install the Hazelcast cluster:
# Install Hazelcast and Mancenter
$ helm upgrade --install hazelcastwithmancenter ./hazelcastwithmancenter --namespace=hazelcastplatform

# Query 'NodePort' for access to Mancenter
$ k -n hazelcastplatform get svc hazelcastimdg-mancenter -o jsonpath="{.spec.ports[0].nodePort}"
31862

# Wait until Pods have become ready
$ watch kubectl -n hazelcastplatform get pod
NAME                                      READY   STATUS    RESTARTS   AGE
hazelcastimdg-0                           1/1     Running   0          2m32s
hazelcastimdg-1                           1/1     Running   0          112s
hazelcastimdg-2                           1/1     Running   0          72s
hazelcastimdg-mancenter-96b879756-qmlkc   1/1     Running   0          2m32s
Then, install the two Hazeltest releases to your cluster:
# Install release writing to 'ht_' maps
# Use scenario 2 'values.yaml' for this command
$ helm upgrade --install hazeltest ./hazeltest --namespace=hazelcastplatform

# Install release writing to 'xx_' map
# Use scenario 3 'values.yaml' for this command
$ helm upgrade --install hazeltest-default-map ./hazeltest --namespace=hazelcastplatform
Let the Hazeltest instances run for a bit and then take a look at the detail view of the xx_load map in the Mancenter. You should see something roughly similar to the following:
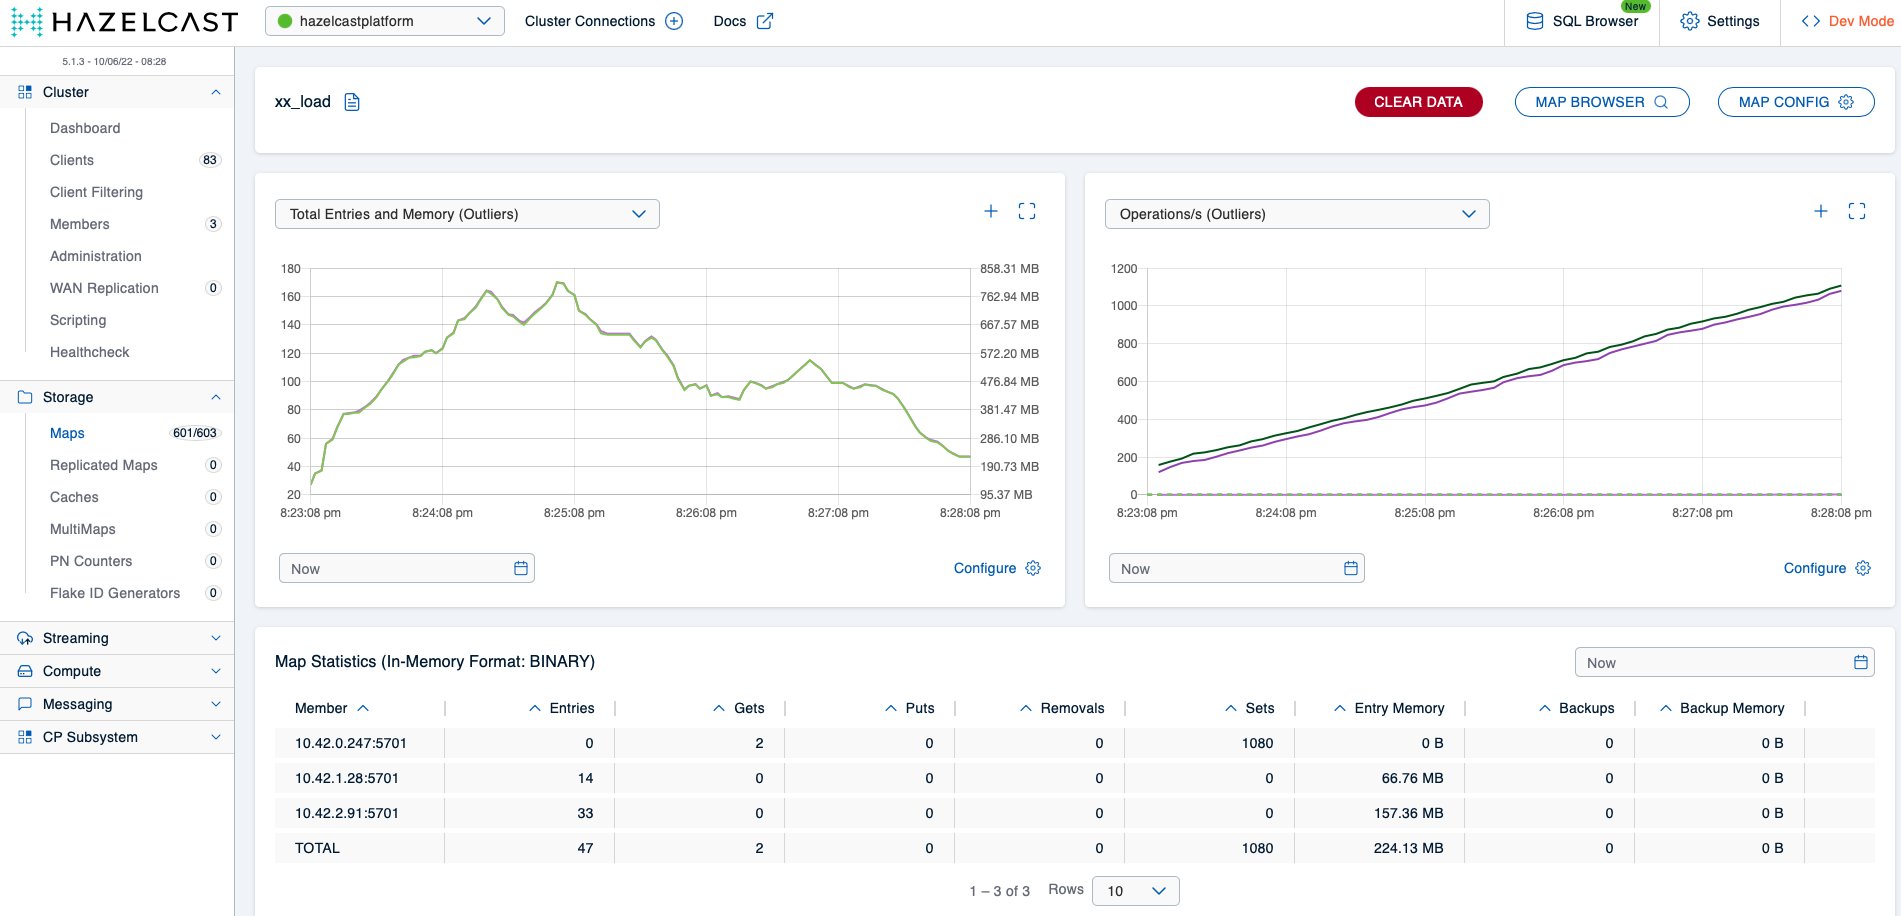
We can perfectly see how the map’s memory usage increases first as long as the eviction policy is not yet active and then gradually drops once the member’s heap usage surpasses 50 %. More interestingly, if you wait yet a bit longer, you’ll notice how the number of entries in the map decreases much further close to zero:
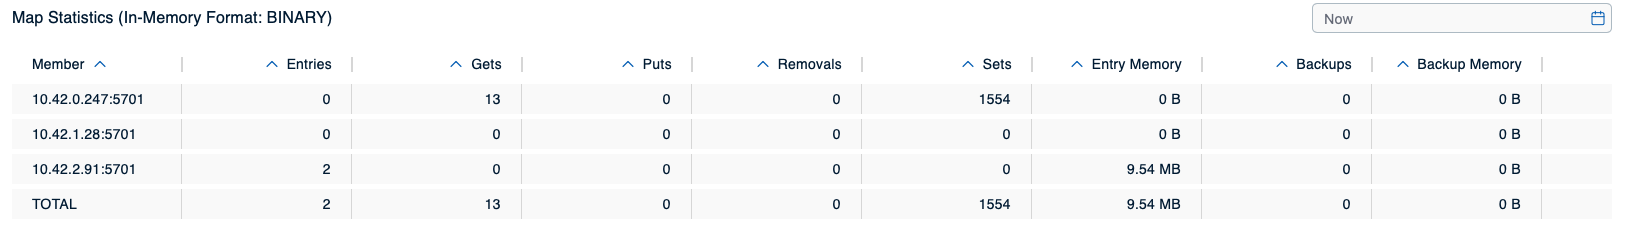
Eventually, the map will be completely drained as the member’s heap usage remains above 50 %, meaning other maps now take precedence over the maps subject to the default configuration. The final map configuration thus produces a Hazelcast cluster that reliably stays operational under all load scenarios we configured Hazeltest to create and that prevents misbehaving client applications from interfering with other map-related actions on the cluster.
Cleaning Up
To uninstall all currently deployed releases from your Kubernetes cluster, run the following commands:
$ helm uninstall hazeltest-default-map --namespace=hazelcastplatform

$ helm uninstall hazeltest --namespace=hazelcastplatform

$ helm uninstall hazelcastwithmancenter --namespace=hazelcastplatform
… or take the shortcut and simply get rid of the entire namespace:
$ k delete ns hazelcastplatform
namespace "hazelcastplatform" deleted
Summary
In its current state, Hazeltest can be used to create load on a Hazelcast cluster in a flexible and easy-to-configure way, an ability we made use of in the previous sections to find, in scope of three simple scenarios, the flaws in each given Hazelcast map configuration. Another way one might phrase this is that Hazeltest can be used to automate the process of generating load according to different configurations as far as maps are concerned.
What’s missing (beyond generating load for other data structures) is the ability to automate the entire testing process – I’ve previously talked about the goal of automating the entire process around asserting the release candidate (here: a Helm chart) producing a Hazelcast cluster is fit for release to production and how the thoroughness of the testing done on the Hazelcast cluster delivers a critical dimension in that fitness statement. Right now, Hazeltest still lacks both the functionality to gather results about its actions on Hazelcast as well as the intelligence to act on those results. To establish both might be a potential next step in the further development of Hazeltest.