Dev Update, More Load Scenarios

Curious about the news on Hazeltest and the two additional load scenarios previously hinted at? Then this new blog post has you covered!
The previous blog post on Hazeltest featured, in its more practical part, a basic How to Hazeltest, demonstrating shortly how the application can be configured, as well as the first of three load generation scenarios. The following paragraphs, then, will pick up the action from there and walk you through the remaining two load generation scenarios. Beyond that, we’re going to spend some time looking at the improvements made to Hazeltest since the previous blog post was published, as well as at the (likely) road ahead for Hazeltest.
First, though, let’s give you a quick refresher on what we talked about in the previous blog post.
The Previous Blog Post In A Nutshell
The previous blog post highlighted the importance of automated testing beyond only the realm of software engineering and introduced the basic idea behind, and most important requirements for, Hazeltest, a small application written in Golang for (no points for guessing) testing Hazelcast clusters. Self-sufficient runners for two of the data structures available in Hazelcast – maps and queues – generate load on the Hazelcast cluster under test, and in scope of the blog post’s more practical part, we talked about how those runners can be tuned in terms of enabling and disabling them, configuring sleeps to increase the realism of the generated load, adjusting data structure usage, and changing a test run’s duration. Finally, the first of three load generation scenarios showed a simple, real-world use case for Hazeltest by demonstrating how the application can be used to identify a misconfiguration in a Hazelcast cluster.
With this short recap done, what’s the news on Hazeltest since the previous blog post was published?
Hazeltest News
In the past couple of weeks between now and the publishing of the previous blog post, three issues on GitHub have been worked on and finished.
Improved Test Automation
GitHub issue: Improve Test Automation
The dogmatists for test-driven development among you may disagree, but I think a small prototype application does not require very comprehensive test automation yet because what matters with a prototype is rapid development iterations. But that’s the catch: Hazeltest is not a small prototype application anymore; it has by now outgrown those shoes. Consequently, I’ve dedicated some time to implementing tests for pretty much the entire code base, and because the code hadn’t been built with test automation in mind, this endeavor resulted in quite a couple of refactorings, too. (And yes, dear TDD dogmatists, you may now go ahead and put on your “I told you so” face.)
All tests have been implemented without any additional mock-foo beyond what is available through Go’s built-in testing package. Renouncing any mocking framework forced me to make the code’s components very modular in order to allow for test dependencies to be injected, which, as a very nice side effect, made the code more maintainable and increased readability.
I think these tests will increase in usefulness in direct relation to the size and complexity of the code base – indeed, to keep the latter in check, test automation is key –, and, of course, they also act as a counter towards regressions. Finally, the tests document the desired behavior of the code, so in case you’re interested in what a certain piece of code is supposed to do, look no further than its corresponding tests!
Random Sleeps
GitHub issue: Introduce Randomness To Sleeps
The sleep functionality previously available was intended to increase the realism of the load generated by the application’s various runners by artificially slowing down the runner’s operations (most of the business applications out there using Hazelcast probably don’t continuously hammer on the cluster with load, after all, but do so depending on their users’ behavior, which might vary depending, for example, on the time-of-day). While the sleeps did successfully slow down the runners, whether this increased realism could probably be a matter of some debate – since the sleeps were static, runners would repeatedly halt their operations for the same amount of milliseconds, which entailed cyclic CPU usage patterns on the Hazelcast cluster under test, which a real business application probably won’t cause very often.
The idea to improve on this, then, was to allow for sleeps to be random within a set interval. On the side of runner configuration, this only entailed introducing a simple property to enable (or disable) random mode (using the between action batches sleep as an example):
# before
sleeps:
  betweenActionBatches:
    enabled: true
    durationMs: 2000

# after
sleeps:
  betweenActionBatches:
    enabled: true
    durationMs: 2000
    enableRandomness: true
The value set for this property is passed into each runner’s sleepConfig so the runner in question can pass it into the test loop it spawns, which can in turn act on it (the number generator is seeded in the application’s main function):
func sleep(sleepConfig *sleepConfig) {

	if sleepConfig.enabled {
		var sleepDuration int
		if sleepConfig.enableRandomness {
			sleepDuration = rand.Intn(sleepConfig.durationMs + 1)
		} else {
			sleepDuration = sleepConfig.durationMs
		}
		lp.LogInternalStateEvent(fmt.Sprintf("sleeping for %d milliseconds", sleepDuration), log.TraceLevel)
		time.Sleep(time.Duration(sleepDuration) * time.Millisecond)
	}

}
So, a user may now choose to enable random mode on all or a subset of the runners’ sleeps so they will cause the runner to pause its actions for a (pseudo-)random time in the closed interval [0, <durationMs>]. Of course, with the durationMs value being the upper boundary, the impact of the sleep randomness in terms of the kind of load generated on the Hazelcast cluster increases in proportion to the value given for durationMs.
Improved Test Loop Status Data Gathering
GitHub issue: Improve Test Loop Status Data Gathering
Previously, the way Hazeltest gathered internal state information to be offered for query on its /status endpoint wasn’t particularly elegant: It was the api package that contained the struct representing the status with its various data fields, which meant the api package encapsulated knowledge about what constitutes test loop status – knowledge, in other words, that should only have to reside in the application’s test loop implementations. Although this state sharing mechanism appeared to be compelling at first thanks to its simplicity, it had introduced a rather strict coupling between the api package on one side and the maps and queues packages containing the test loop implementations on the other, in turn making the mechanism brittle and hostile to change or extension.
The idea, then, was to implement passing the internal state information to the api package in such a way that the knowledge about the state itself can reside within the test loops (or some actor within the code that the test loop implementations in the maps and queues packages share, but is located outside the api package) – ideally, the api package would only know to how to convert whatever structure the state is represented in to a format convenient for consumers of the information when delivered via the /status endpoint.
To achieve this, a little refactoring was conducted, resulting in the new status/gatherer.go file. In there, the state information is represented simply as map[string]any, itself isolated in a struct that exports a channel other actors in the program can use to insert status updates, as well as methods to start and stop listening for updates on the channel:
// Excerpt from 'status/gatherer.go'
type (
	Update struct {
		Key   string
		Value any
	}
	Gatherer struct {
		l      locker
		status map[string]any
		Updates chan Update
	}
	// ...
)

// ...

func (g *Gatherer) Listen() {

	g.insertSynchronously(Update{Key: updateKeyRunnerFinished, Value: false})

	for {
		update := <-g.Updates
		if update == quitStatusGathering {
			g.insertSynchronously(Update{Key: updateKeyRunnerFinished, Value: true})
			close(g.Updates)
			return
		} else {
			g.insertSynchronously(update)
		}
	}

}

func (g *Gatherer) StopListen() {

	g.Updates <- quitStatusGathering

}

// ...
(Strictly speaking, employing a channel to process the very simple and little state information today’s test loops report would not have been necessary, but the asynchronicity offered by channels will come in handy when implementing another enhancement). The api package is not informed directly about the state available in a status gatherer’s map[string]any, but receives a method on the pointer receiver of the status gatherer that yields a copy of the map:
// Another excerpt from 'status/gatherer.go'

// ...
func (g *Gatherer) AssembleStatusCopy() map[string]any {

	mapCopy := make(map[string]any, len(g.status))

	g.l.lock()
	{
		for k, v := range g.status {
			mapCopy[k] = v
		}
	}
	g.l.unlock()

	return mapCopy

}
// ...
Those methods – plural because each test loop registers this method with the api package – are only actually invoked when actors external to the application call the /status endpoint, and the api package only knows how to transform the information thus gathered into a JSON structure for convenient consumption by those actors:
// Excerpt from 'api/status.go'

//...
func assembleTestLoopStatus() map[TestLoopType]any {

	mapTestLoopStatus := map[string]any{}
	populateWithRunnerStatus(mapTestLoopStatus, &mapTestLoopStatusFunctions)

	queueTestLoopStatus := map[string]any{}
	populateWithRunnerStatus(queueTestLoopStatus, &queueTestLoopStatusFunctions)

	return map[TestLoopType]any{
		MapTestLoopType:   mapTestLoopStatus,
		QueueTestLoopType: queueTestLoopStatus,
	}

}

func populateWithRunnerStatus(target map[string]any, statusFunctionsMap *sync.Map) {

	statusFunctionsMap.Range(func(key, value any) bool {
		runnerStatus := value.(func() map[string]any)()
		if runnerStatus != nil {
			target[key.(string)] = runnerStatus
		} else {
			target[key.(string)] = map[string]any{}
		}
		return true
	})

}
//...
You can find the full source code of the status/gatherer.go file over here.
With the news session out of the way, let’s shift our attention to the two remaining load generation examples.
Load Scenarios
Because the following two load generation examples are the continuation of the last blog post’s first example, the numbering continues where the last scenario left off.
Also worth pointing out: Like in the last blog post, the commands shown in the following sections assume you’re in the resources/charts directory of a local copy of the Hazeltest repo.
Load-Generation Example: Scenario 2
In the last blog post’s scenario 1, we’ve assembled a Hazelcast cluster configuration able to handle a specific kind of load generated by Hazeltest: Small number of maps, small number of clients, and lots of data to be stored. So far, this kind of load could have been easily generated using PadoGrid, too, so up until here, there hasn’t been any real advantage in using Hazeltest (except maybe the fact that, thanks to Helm, we were able to spawn Hazeltest clients with updated configurations very quickly). As mentioned in the previous blog post, though, the amount of data to be stored is not the only dimension of load – the number of clients as well as the number of maps matter, too. Therefore, in the following sections, we’re going to increase both the number of clients and the number of maps and see how the Hazelcast configuration we’ve come up with in the previous scenario is able to handle the load thus generated.
In case you’ve followed along until here and have a clean Hazelcast cluster running, you’re all set for the first Hazeltest configuration, but in case you’ve jumped right into the action starting with scenario 2, you can find the Hazelcast configuration file over here, which you can use to install Hazelcast like so:
$ helm upgrade --install hazelcastwithmancenter ./hazelcastwithmancenter --namespace=hazelcastplatform --create-namespace
The following is an excerpt from the first Hazeltest configuration file we’re going to throw against the cluster (full file here):
replicaCount: 10

image:
  registry: docker.io
  organization: antsinmyey3sjohnson
  repository: hazeltest
  # New image!
  # 0.7.0
  digest: 9f2ab556c5c31e5e60ff84cbd6a107922c3a3be2c1cace4825af78347f14d4d6
  pullPolicy: IfNotPresent

# ...

config:
  # ...
  maptests:
    pokedex:
      enabled: true
      numMaps: 10
      appendMapIndexToMapName: true
      appendClientIdToMapName: true
      mapPrefix:
        enabled: true
        prefix: "app1_"
      sleeps:
        # ...
    load:
      enabled: true
      numMaps: 10
      appendMapIndexToMapName: true
      appendClientIdToMapName: true
      mapPrefix:
        enabled: true
        prefix: "app1_"
      sleeps:
        # ...
(Please note the new version of Hazeltest used here – the improvements you’ve read about earlier resulted in a new image, version 0.7.0, which we’re using here.)
This time, we use 10 Hazeltest instances rather than 2, and both append* properties for both map runners have been set to true, which will give us 20 Hazelcast clients (10 instances * 2 runners each, where each runner initializes its own Hazelcast client) and 200 maps in total (10 instances * 10 map goroutines using their own maps for 2 runners), versus the 2 maps we got with both Hazeltest configurations in scenario 1. Meanwhile, the two queue runners have been disabled for this scenario. Also, note that both runners write to the app1 prefix.
So, what happens when we throw this at the current Hazelcast configuration? One might assume the cluster will be fine because our map configuration for the app1 prefix has proven in scope of the previous scenario that its eviction policy is able to protect the cluster in the face of clients generating a lot of memory load, but does this config also work for the kind of load generated by the above Hazeltest config? Let’s find out:
# Install Hazeltest
$ helm upgrade --install hazeltest-app1 ./hazeltest --namespace=hazelcastplatform
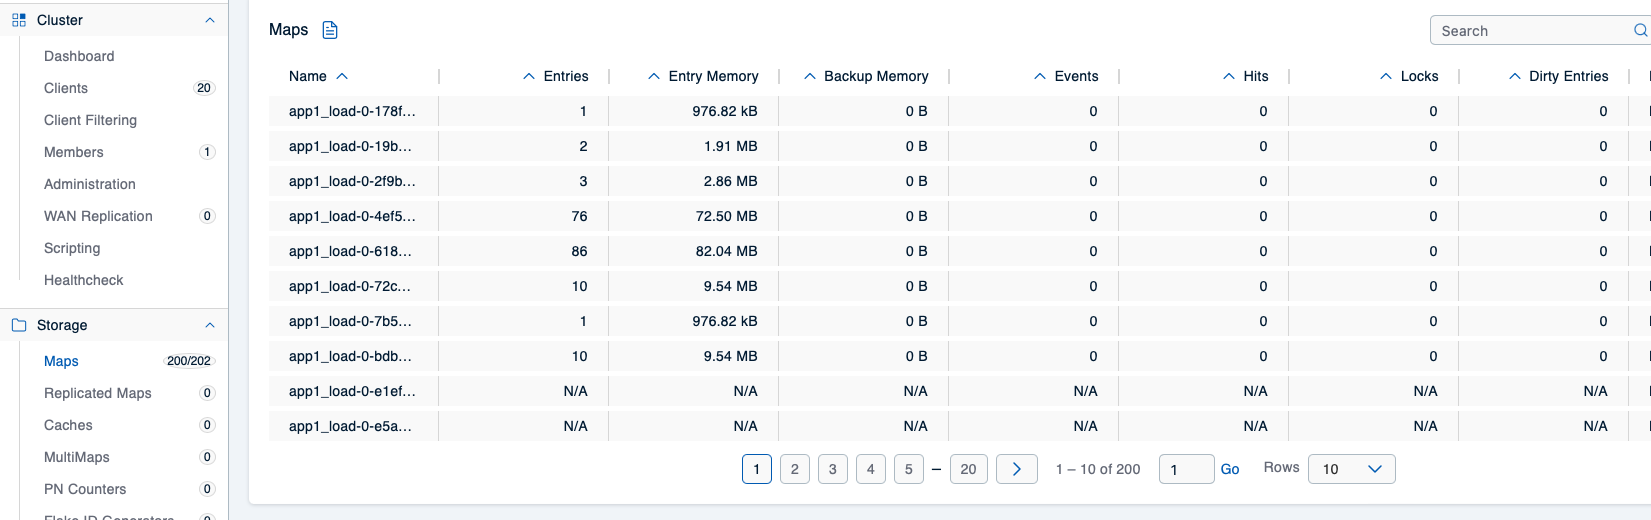
After all Hazeltest instances have become ready, the Mancenter will confirm the number of clients and maps given above (202 maps displayed due to 2 system-internal maps):
Hurry up with checking the Mancenter, though, because the Hazelcast cluster will crash quickly:
$ watch kubectl -n hazelcastplatform get po --selector="app.kubernetes.io/name=hazelcastimdg"
NAME              READY   STATUS             RESTARTS      AGE
hazelcastimdg-0   0/1     CrashLoopBackOff   6 (95s ago)   14m
So that didn’t go well, and the Mancenter’s web UI will soon crawl with funky red error messages. What happened? Let’s revisit the app1 map config currently in place in our Hazelcast cluster:
map:
  # ...
  app1*:
    backup-count: 1
    max-idle-seconds: 600
    in-memory-format: BINARY
    eviction:
      eviction-policy: LRU
      max-size-policy: USED_HEAP_PERCENTAGE
      size: 80
  # ...
The max-size-policy for how the app1 maps are to be evicted has been set to USED_HEAP_PERCENTAGE, and according to Hazelcast’s documentation on map eviction policies, the percentage refers to the used heap size in Megabytes per map for each Hazelcast instance. From the previous scenario, we know that the map load runners exhausted the cluster’s memory capacity, but they did so with a very low number of maps (only two). In the Hazelcast configuration for scenario 2, the number of elements and their size – hence the overall size of data to be stored – haven’t changed, but the data is now distributed across 200 maps (100 load maps, 100 Pokédex maps), and the screenshot given above shows the effect of this: Each map now holds only a very small portion of the data. For this reason, the USED_HEAP_PERCENTAGE eviction policy never kicks in because the condition – here: 80 % of the heap used by the map – is never met, causing the cluster member to crash almost instantly.
This is an example for the importance of effective cross-team collaboration (between the team running Hazelcast and the team responsible for the application that will use it): The kind of load an application will cause on Hazelcast has to be agreed on and communicated so the Hazelcast team can provide the correct configuration for the data structures the application wishes to use. For load scenarios like the above – applications that use many maps to store their data in –, the FREE_HEAP_PERCENTAGE max size policy might be more appropriate because it works based on the percentage of free heap space for each Hazelcast instance. Thus, to handle the load generated by the above Hazeltest configuration better, one could update the app1 config like so:
map:
  # ...
  app1*:
    backup-count: 1
    max-idle-seconds: 600
    in-memory-format: BINARY
    eviction:
      eviction-policy: LRU
      max-size-policy: FREE_HEAP_PERCENTAGE
      size: 40
  # ...
While this will work, it comes with a significant downside: This configuration will throw away 40 % of the memory available on the heap, thus significantly reducing the amount of data clients can store in app1 maps. And that is a waste indeed, as the problematic clients with the Hazeltest configuration above are the load runner clients, not the Pokédex runner clients. So, it makes sense the provide one general and one more specific app1 config, for example:
map:
  # ...
  app1_load*:
    backup-count: 1
    max-idle-seconds: 600
    in-memory-format: BINARY
    eviction:
      eviction-policy: LRU
      max-size-policy: FREE_HEAP_PERCENTAGE
      size: 40
  app1*:
    backup-count: 1
    max-idle-seconds: 600
    in-memory-format: BINARY
    eviction:
      eviction-policy: LRU
      max-size-policy: FREE_HEAP_PERCENTAGE
      size: 15
  # ...
(One might even consider going back to USED_HEAP_PERCENTAGE for app1, but because even the Pokédex runners use so many small maps, that may be the less-than-ideal choice.)
With the new Hazelcast config in place, let’s re-install the cluster (full config file here):
# This will cause the only Hazelcast Pod to restart, thus wiping the previous state
$ helm upgrade --install hazelcastwithmancenter ./hazelcastwithmancenter --namespace=hazelcastplatform
At this point, the Hazeltest Pods should still be running, so once they’ve reacquired their connection with Hazelcast, we can view the Mancenter and check whether the new config did the trick:
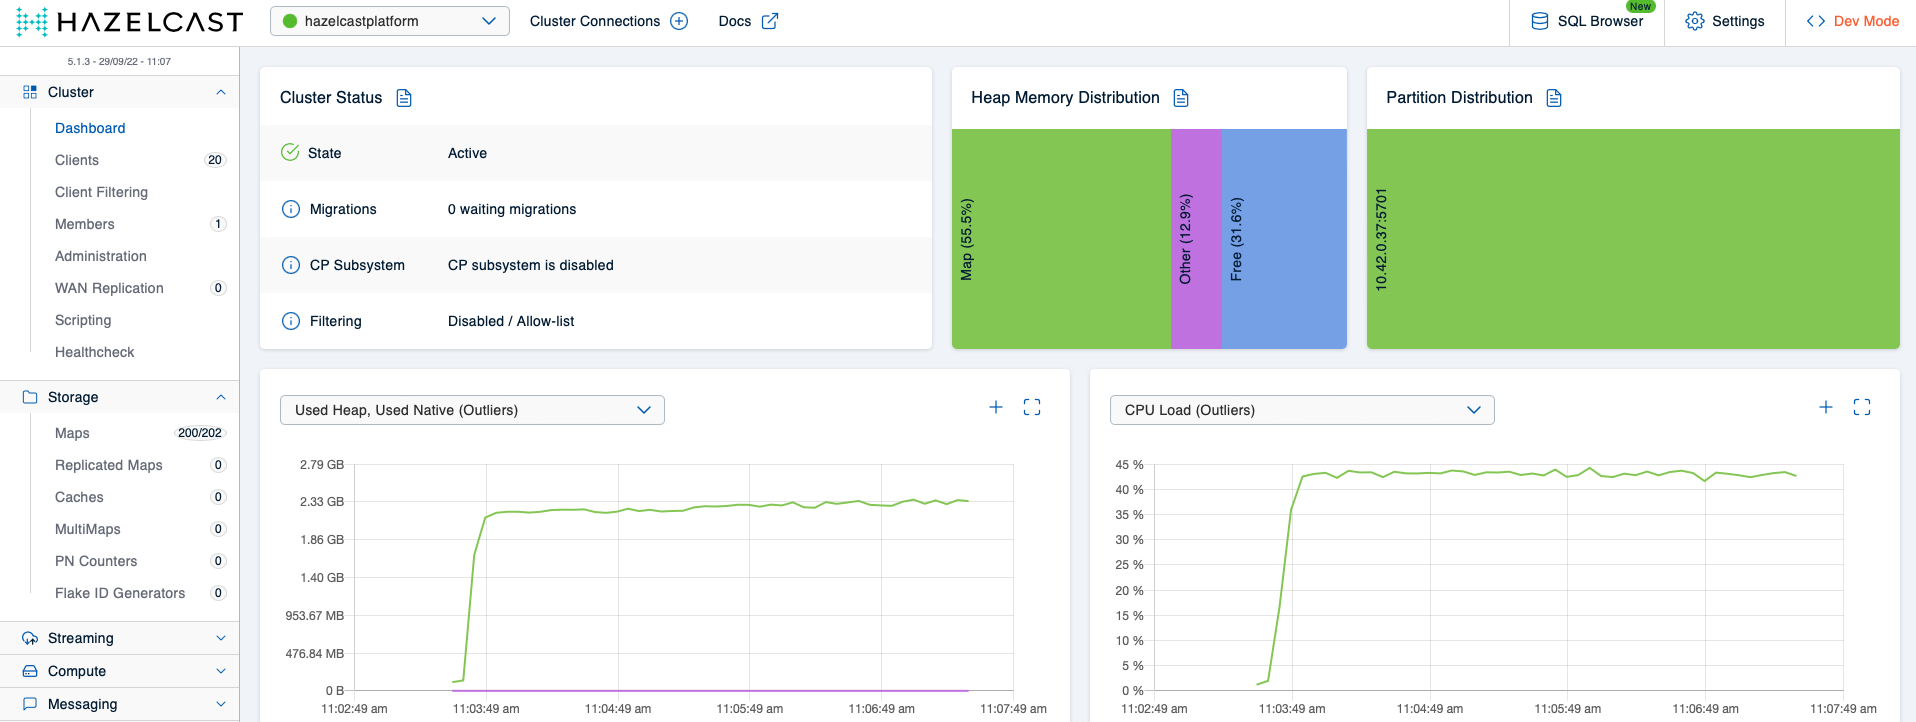
Looks like the cluster is able to handle the load quite nicely, and our Pod watch doesn’t give reason to assume otherwise, either:
$ watch kubectl -n hazelcastplatform get po --selector="app.kubernetes.io/name=hazelcastimdg"
NAME              READY   STATUS    RESTARTS   AGE
hazelcastimdg-0   1/1     Running   0          9m48s
Let’s up our game, then, and apply the last Hazeltest config for this scenario. There are two differences compared to the previous configuration, namely, the number of replicas, which we’ve increased to 40, and the map prefix for the load runner’s maps, which we’ve configured to be app1_load_ now so it corresponds to the app1_load* config pattern in Hazelcast:
replicaCount: 40

# ...

config:
  # ...
  maptests:
    # ...
    load:
      # ...
      mapPrefix:
        enabled: true
        prefix: "app1_load_"
      # ...
You can find the full config file over here.
With a replica count of 40 and the load runner’s map prefix adjusted, we’ll get 80 clients on Hazelcast and a total of 800 maps. After having restarted Hazelcast once more and applied the new config…
# As always...
$ alias k=kubectl

# (Will only wipe state if Hazelcast cluster consists of one member -- reinstall in case you've increased the member count)
$ k -n hazelcastplatform rollout restart statefulset hazelcastimdg

# Install new release of Hazeltest
$ helm upgrade --install hazeltest-app1 ./hazeltest --namespace=hazelcastplatform
…, you should see roughly the following in the Mancenter:
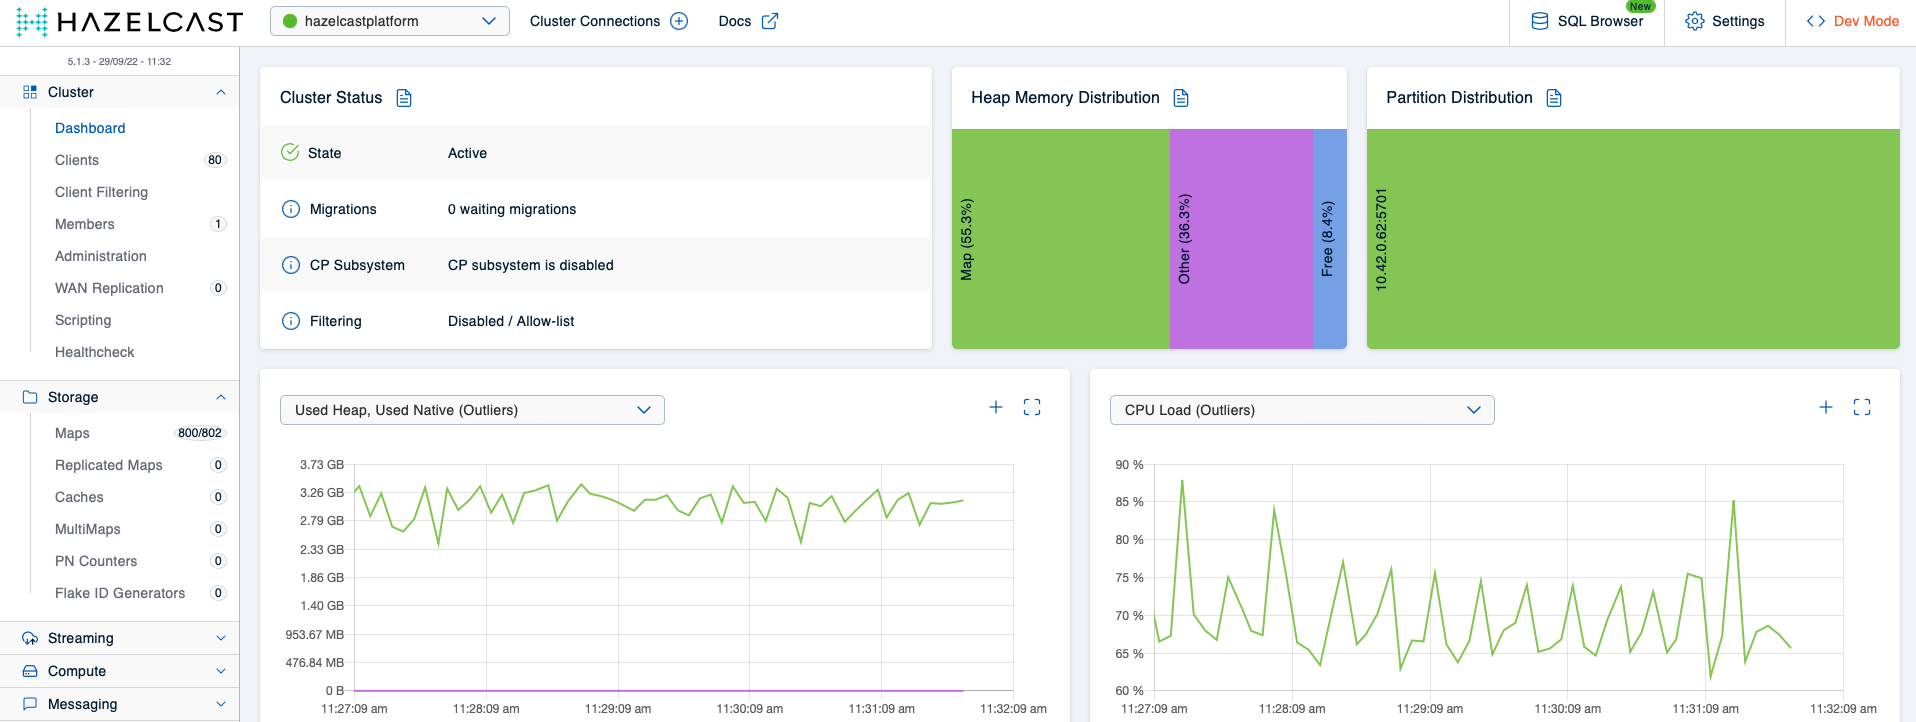
This shows that the app1_load and app1 map configs are sufficient to protect the cluster from crashing even when 40 Hazeltest instances generate load via 80 clients on 800 maps. For the sake of completeness, let’s verify there are no restarts on our single cluster member:
$ watch kubectl -n hazelcastplatform get po --selector="app.kubernetes.io/name=hazelcastimdg"
NAME              READY   STATUS    RESTARTS   AGE
hazelcastimdg-0   1/1     Running   0          13m
Looking good, too! With this Hazelcast config in place, we can safely move on to the next scenario, but first, let’s create an entirely clean slate by uninstalling both the Hazelcast cluster and all Hazeltest instances (you’ll see in the next section why that’s necessary):
# Uninstall Hazelcast
$ helm uninstall hazelcastwithmancenter --namespace=hazelcastplatform

# Uninstall Hazeltest
$ helm uninstall hazeltest-app1 --namespace=hazelcastplatform
Load-Generation Example: Scenario 3
In this next and final scenario, I’d like to show you that increasing the number of clients and the number of data structures those clients interact with not only affects the Hazelcast cluster itself, but also the Mancenter in case it has been configured to collect metrics. This correlation may not be that obvious at first – at least not as obvious as the correlation between Hazeltest clients and the Hazelcast cluster –, hence I thought it may be useful to demonstrate how increased load impacts the Mancenter, too, and to show a way how that impact can be mitigated.
For this scenario, we’re going to need much more load generated by Hazeltest, and a Hazelcast cluster able to handle it. Because of this, we’re going to start this scenario with completely new configurations both for Hazelcast and for Hazeltest (that’s the reason you uninstalled both completely at the end of the previous scenario). The new Hazelcast configuration comes with three members instead of only one, and each member is given more CPU and memory. Additionally, both the map and the queue configurations for Hazelcast have been simplified to contain only a default config and one for the ht_* pattern – since the focus this time is not on Hazelcast’s data structure configuration, having more sophisticated configuration here would only be distractive. Beyond this, the Mancenter also receives much more memory in this configuration.
The following shows excerpts from the Hazelcast configuration outlining the aforementioned differences (full file here):
platform:
  # ...
  cluster:
    # ...
    members:
      # ...
      # Three members this time rather than only one
      count: 3
      # More CPU and memory
      containerResources:
        requests:
          cpu: "4"
          memory: "6G"
        limits:
          cpu: "6"
          memory: "6G"
      jvmResources:
        xmx: 4800m
        xms: 4800m
      # ...
  config:
    hazelcast:
      # ...
      # Simpler configurations both maps and queues -- only default and one specific config
      map:
        default:
          backup-count: 0
          max-idle-seconds: 5
          in-memory-format: BINARY
          eviction:
            eviction-policy: LRU
            max-size-policy: FREE_HEAP_PERCENTAGE
            size: 50
        ht_*:
          backup-count: 1
          max-idle-seconds: 600
          in-memory-format: BINARY
          eviction:
            eviction-policy: LRU
            max-size-policy: FREE_HEAP_PERCENTAGE
            size: 15
      queue:
        default:
          max-size: 10
          backup-count: 0
          empty-queue-ttl: 10
        ht_*:
          max-size: 10000
          backup-count: 1
          empty-queue-ttl: 120

mancenter:
  # ...
  instance:
    # ...
    # The Mancenter comes with container support, so we don't need to set JVM args
    resources:
      requests:
        cpu: "2"
        memory: "20G"
      limits:
        cpu: "4"
        memory: "20G"
Go ahead and install Hazelcast using this configuration:
$ helm upgrade --install hazelcastwithmancenter ./hazelcastwithmancenter --namespace=hazelcastplatform
This will spawn three cluster members plus the Mancenter, and while we’re waiting for them to come up, let’s take a look at an excerpt from the Hazeltest config (full file here):
replicaCount: 80

# ...

resources:
  requests:
    cpu: "100m"
    memory: "32Mi"
  limits:
    cpu: "200m"
    memory: "64Mi"

# ...

config:
  queuetests:
    tweets:
      enabled: true
      numQueues: 10
      appendQueueIndexToQueueName: true
      appendClientIdToQueueName: true
      # ...
    load:
      enabled: true
      numQueues: 10
      appendQueueIndexToQueueName: true
      appendClientIdToQueueName: true
      # ...

  maptests:
    pokedex:
      enabled: true
      numMaps: 20
      appendMapIndexToMapName: true
      appendClientIdToMapName: true
      # ...
    load:
      enabled: true
      numMaps: 20
      appendMapIndexToMapName: true
      appendClientIdToMapName: true
      # ...
The first thing you may have noticed is the sharply increased number of replicas we’re going to spawn, namely twice of what we’ve used in the previous scenario. Unfortunately, my RKE cluster does not have enough resources to handle the now more resource-hungry Hazelcast cluster and the Mancenter plus 80 instances of Hazeltest with the previous resource configuration, so to make 80 instances fit onto my cluster, I had to reduce their resources.
Another thing that might have caught your attention is the fact that both append* properties have been set to true for all runners in this scenario in order to maximize the number of data structures this configuration will create in Hazelcast. Let’s do a quick calculation to see how many data structures the above configuration will give us:
- Number of Hazelcast clients: 80 * 4 (because each Hazeltest instance uses one client for each enabled runner, and we have all four runners enabled) –> 320
- Number of queues: 80 * 10 for each enabled queue runner, hence 80 * 10 * 2 –> 1.600
- Number of maps: 80 * 20 for each enabled map runner, hence 80 * 20 * 2 –> 3.200
Configured like this, Hazeltest will create 320 clients and 4.800 data structures in total on the Hazelcast cluster under test. Let’s install Hazeltest:
$ helm upgrade --install hazeltest ./hazeltest --namespace=hazelcastplatform
As the first step after the installation, we’ll go check out the Mancenter for the cluster state, and while we’re there, it doesn’t hurt to verify the numbers calculated above are reflected in the cluster state:
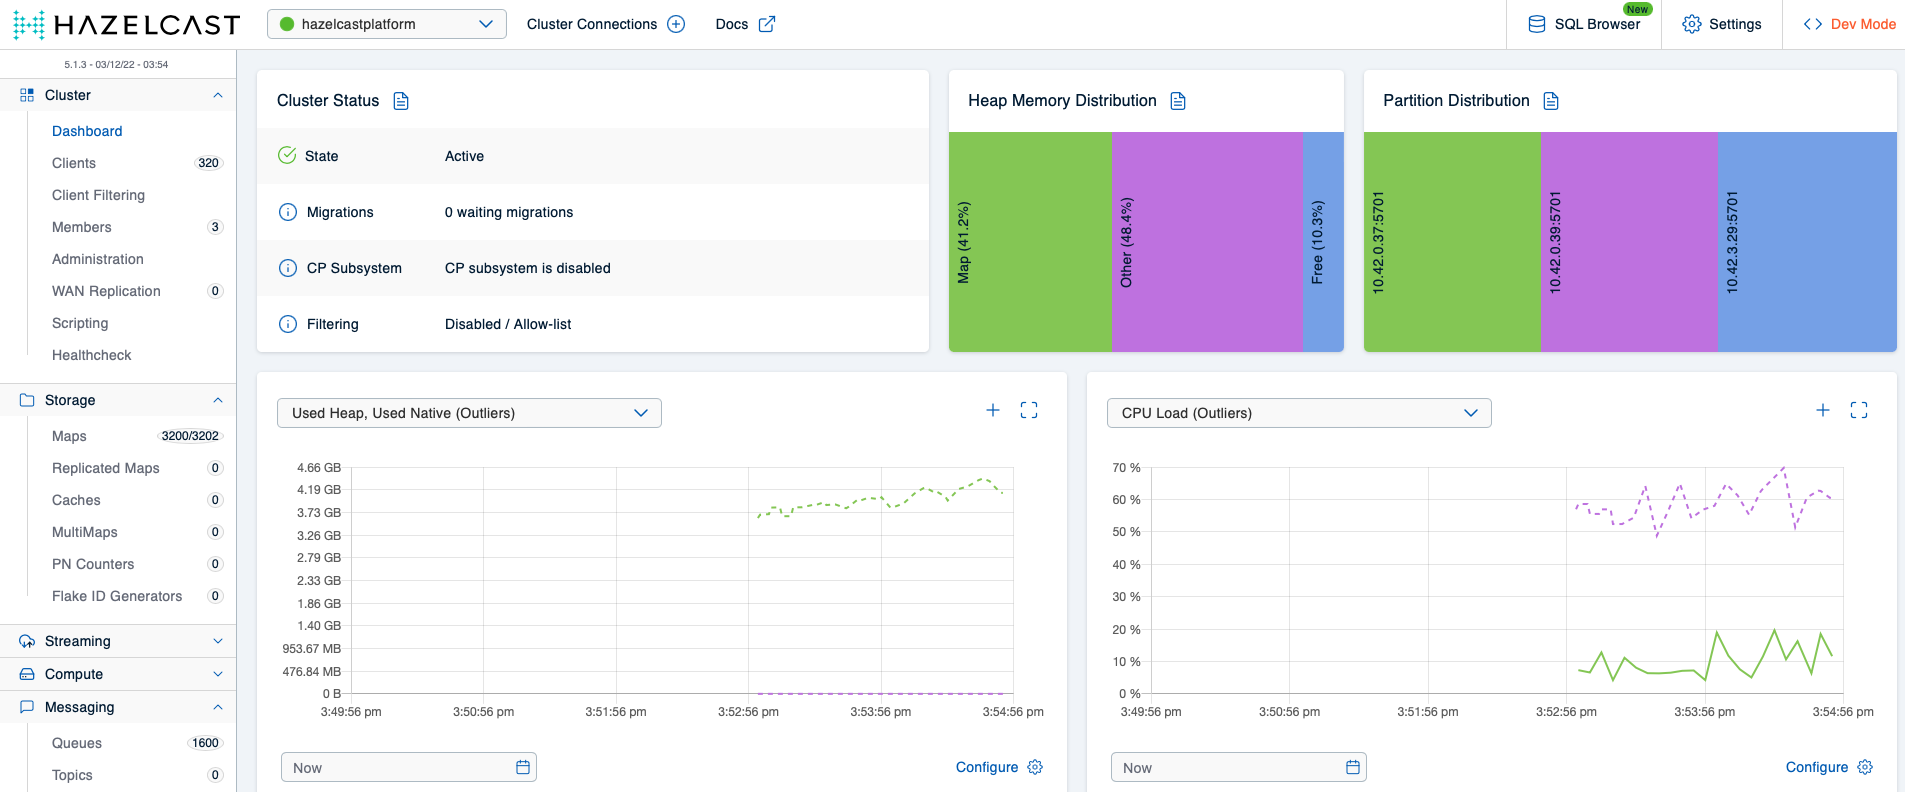
The cluster looks healthy and the data given for number of clients, number of maps, and number of queues corresponds to our expectations, so in the world of the cluster members themselves, all seems to be well. However, let’s check the memory consumption of the Mancenter after having let this setup run for a couple of minutes:
$ k -n hazelcastplatform top pod -l app.kubernetes.io/name=hazelcastimdg-mancenter
NAME                                       CPU(cores)   MEMORY(bytes)
hazelcastimdg-mancenter-5d4dd4d67b-wx925   1057m        16023Mi
After having waited for only five minutes, the Mancenter’s memory usage has increased to a whopping 16G! Just to put this into perspective, this is about as much as the memory consumption of all Hazelcast cluster members combined:
$ k -n hazelcastplatform top pod -l app.kubernetes.io/name=hazelcastimdg
NAME              CPU(cores)   MEMORY(bytes)
hazelcastimdg-0   3221m        5167Mi
hazelcastimdg-1   5174m        5151Mi
hazelcastimdg-2   3196m        5145Mi
Those Hazelcast members have been restricted to a memory limit of 6G each, but it still seems odd to have the component monitoring the system that stores data consume just as much memory as the system doing the actual storing. Of course, one might be inclined to reduce the Mancenter’s memory consumption by simply decreasing the memory limit on the corresponding PodSpec (full file here) because that will also decrease the max heap size thanks to the Mancenter’s container support:
mancenter:
  # ...
  instance:
    # ...
    resources:
      requests:
        cpu: "2"
        memory: "16G"
      limits:
        cpu: "4"
        memory: "16G"
With the same kind of load generated by Hazeltest, this doesn’t go so well for the Mancenter, though, which you’ll see once you’ve applied the updated config and let it run for a short while:
$ k -n hazelcastplatform get pod -l app.kubernetes.io/name=hazelcastimdg-mancenter
NAME                                       READY   STATUS    RESTARTS      AGE
hazelcastimdg-mancenter-7cd7f64f8d-vdkmf   0/1     Running   1 (28s ago)   6m54s
So, what else can we do to decrease the Mancenter’s lust for memory? Well, since Hazelcast members offer their metrics to be polled by the Mancenter in a certain interval, one might ask if there’s a property somewhere one can use to control just that interval. As it turns out, there is – it’s called collection-frequency-seconds and it’s a property in the hazelcast.metrics configuration on the member’s side. As suggested by its name, the property allows control over the frequency with which the Hazelcast members’ metrics system collects metrics (this piece of Hazelcast documentation has the details in store for you). By default, metrics are collected every five seconds, and decreasing the frequency to something like 30 seconds means the Mancenter will end up having viewer data points to crunch, thus reducing the memory it needs.
Sounds promising, so let’s go ahead and launch ourselves a new Hazelcast cluster with this property added and configured (full config file here):
platform:
  # ...
  config:
    hazelcast:
      metrics:
        enabled: true
        # Default is 5 -- by setting this to a higher value, one can decrease load on the Management Center
        # because it will receive fewer data points to work with
        collection-frequency-seconds: 30
        # ...
  # ...

# ...
mancenter:
    resources:
      requests:
        cpu: "2"
        memory: "16G"
      limits:
        cpu: "4"
        memory: "16G"
(As you can see, the Mancenter still runs with only 16G of memory.)
We can now install the Hazelcast cluster and the Mancenter again, and start generating the same load as previously once all members have come up:
# Install Hazelcast
$ helm upgrade --install hazelcastwithmancenter ./hazelcastwithmancenter --namespace=hazelcastplatform

# Install Hazeltest
$ helm upgrade --install hazeltest ./hazeltest --namespace=hazelcastplatform
This time, the Mancenter is easily able to work within the 16G boundary provided in the PodSpec’s limits:
$ k -n hazelcastplatform top pod -l app.kubernetes.io/name=hazelcastimdg-mancenter
NAME                                       CPU(cores)   MEMORY(bytes)
hazelcastimdg-mancenter-7cd7f64f8d-hsjnv   606m         12824Mi
Of course, close to 13G of memory consumption is still a lot – and presumably a lot more than what you’d expect considering the fact that we’ve decreased the frequency of metrics collection by a factor of six. Based on observations I’ve made with older iterations of my client’s Hazelcast clusters, it seems the effect of adjusting the metrics collection frequency depends on the number of Hazelcast cluster members, so the impact seems to increase the more members there are in the cluster. Sadly, at the time of this writing, I don’t have a Hazelcast enterprise license, and because free usage of the Mancenter is limited to three members, I can’t test this assumption on my RKE cluster.
Still, the above load scenario highlights the importance of load-testing Hazelcast clusters not only along the dimensions of number and size of entries to be stored, but also along the dimensions of number of clients and number of data structures those clients use. The aforementioned older iterations of my client’s Hazelcast clusters, had, in fact, not been tested for this initially because, at the time, we lacked the tools – I talked at length about the insufficiencies of pre-Hazeltest testing of Hazelcast clusters in the previous blog post –, and we ended up having to deploy a fix to production because the Mancenter kept crashing. (As you can imagine, this particular experience was yet another driver behind implementing Hazeltest in such a way that you can easily adjust the number of clients and the number of data structures.)
Finally, you’ll probably want to clean up your Kubernetes cluster, which you can achieve like so:
# Shortcut: Delete entire namespace
$ k delete ns hazelcastplatform

# Or delete Helm releases individually
$ helm uninstall hazeltest --namespace=hazelcastplatform
$ helm uninstall hazelcastwithmancenter --namespace=hazelcastplatform
This wraps up our two load scenarios for this blog post. Let’s see what the future will have in store for Hazeltest!
The Road Ahead
The current state of Hazeltest delivers load generation capabilities that I have found to be useful for testing Hazelcast clusters in scope of work for my current project – we use the application for all kinds of load generation purposes to verify a certain Hazelcast configuration results in a cluster that remains stable even when working under maximum capacity on all load dimensions. My hope is that the demo above provides a good way to get started with the application, and that it helps you verify your Hazelcast configurations, too.
But, there is still a lot of work to do, and to simplify reasoning about it, I’d like to categorize it into three areas: runners, load generation vs. reporting vs. evaluation, and a new feature that you might call the “Chaos Monkey”.
Runners
The various runners Hazeltest offers are the application’s bread and butter as they deliver the means to generate load scenarios for testing different Hazelcast configurations. There are currently two areas where I see the most potential for improvement in the runner context (though others may very well exist), namely, load generation and configuration complexity.
Load Generation
Earlier on, in the list of requirements, intelligent test logic was described as the idea that the application should offer easily configurable test loops that generate realistic and heterogeneous load on the Hazelcast cluster under test. This state has been achieved to a certain degree, but the realism and heterogeneity could be further increased. More specifically, I would like to:
- … introduce more randomness. This includes things like enabling “random mode” for the existing sleep mechanism, randomly skipping test loops in a runner, make the order of operations random, and – what I think might be particularly interesting – provide the functionality for random load spikes to occur (if so desired by the user – of course, this and every other piece of new or modified functionality has to be configurable).
- … add the option to make the load generation subject to the current daytime. Applications exposed to end users out there in the wild tend to experience typical usage patterns of peak traffic during normal business hours and traffic being almost flat at night. Hazeltest’s runners could apply a kind of modifier to their load generation depending on the current daytime in order to align their load generation behavior with the load that real business applications impose on Hazelcast clusters.
- … introduce more runners. I’d like to offer more runners in Hazeltest to make the load all runners combined can create yet more heterogeneous and realistic, particularly in combination with the aforementioned improvements, which all runners would benefit from.
All of these measures combined are supposed to simulate a range of different business applications accessing, and generating load on, a Hazelcast cluster such that Hazeltest’s runners can mimic the “zoo” of business applications an organization’s Hazelcast clusters might typically serve.
Configuration Complexity
Having a piece of logic at one’s disposal that generates load on a Hazelcast cluster is a promising start, but one that does not provide a lot of value if said piece of logic cannot be configured to suit one’s needs. The flexibility in configuring Hazeltest’s runners, then, is a kind of catalyst turning potential into true value. That being said, the new features described above will have to be configurable through the Yaml configuration file to serve the user best (or, at least, it must be possible to override the defaults).
That being said, the fact that more features – and with them, more exposed options to configure them – are yet to come is both a blessing and a curse: On the one hand, more features along with options exposed to configure them increase the versatility of load generation (good), but that will also introduce more complexity, both in the code and from the user’s perspective, who is faced with the challenge of applying the correct configuration (bad – m’kay?). The latter point runs counter to the requirement that Hazeltest be easy to use, so if more configuration options get introduced, there’ll have to be a mechanism to keep the configuration complexity at bay.
The main mechanism to reduce the user-side complexity is that all individual properties can be overridden by the user-supplied config file, and all other properties will be read from the embedded default configuration file. Yet, as the number of configuration options increases sharply, the user is faced with an important question: “What the hell do all those bells and whistles do?” Or, more elaborately: “How do I have to configure the application’s runners to achieve a certain load outcome?”
To address this, the test logic could be extended such that it’s able to work with configuration presets that are based on configuration files embedded in the code itself alongside the defaultConfig.yaml file. So, the user could simply specify a preset at program startup using a command-line argument, and the logic of the various runners would build their internal configuration from that. This would complement the pre-built test loops by adding their configuration counterpart – pre-built configs users may choose based on the kind of use cases they want Hazeltest to address. Beyond simplifying the switch from one load generation config to another without having to alter a configuration file somewhere, the preset files would also act as a kind of documentation for the user as they would serve as examples for how runners have to be configured to generate a specific load pattern. Plus, since the configuration files will all be in Yaml – like the existing defaultConfig.yaml file –, those examples will be relatively easy to read and understand.
Load Generation vs. Reporting vs. Evaluation
Answering the very broad overarching question – “How can we test Hazelcast clusters?” – can be roughly divided into three areas, namely, load generation, reporting, and evaluation.
(Before we go any further: You may be asking yourself about the difference between the latter two, and that is indeed debatable. My take is this: Reporting acts on a set of raw data in order to condense it – for example, by filtering out the irrelevant bits and/or aggregating the data, whereas evaluation comprises acting, in turn, on the generated report, that is, deriving a useful and, ideally, reliable conclusion from the report, such as whether a test was a success. This distinction between the two may not be entirely accurate, but I hope it will nonetheless serve us well as the basis in the following section.)
Currently, all of Hazeltest’s features are focused on the first area (even the elaborate logging and the status endpoint – they deliver lots of information about how a test is going, but there is no reporting logic built on top), and even that is still susceptible to improvement, as we have seen above. Thus, the next thing I’m going to dedicate some time to is adding more functionality to the load generation part along the lines described earlier.
The reporting aspect is a considerably tougher nut to crack because the notion of what constitutes “success” or “failure” of a test will very likely vary between different Hazelcast clusters due to the vastly different requirements organizations may have for their clusters. Due to these differences, the requirements for accurate reporting will differ, too, making it hard to build a one-size-fits-all solution.
The toughest nut of the three, though, is the third one, evaluation, and that’s due to the aforementioned differences in what organizations might classify as a test success or failure. For example: An entry in a map getting evicted (and hence not being available for reads anymore) might be fine for one use case, but an absolute no-no for another, so the evaluation logic built on the reporting couldn’t simply assume one or the other for test success or failure. If it still did, whether the evaluation results are reliable would depend on how closely an organization’s specific use cases for their Hazelcast clusters happen to be aligned with the assumptions Hazeltest’s evaluation logic made, rather than the objective behavior of these Hazelcast clusters.
Hazeltest could, of course, offer a pre-defined configuration for test-relevant data structures which teams could integrate into their existing Hazelcast clusters, in order to run tests only on those structures, but there would be a lot of potential for producing unreliable evaluation results, here, too, because the reliability would depend on (a) the correctness of integrating the test-relevant configuration, and (b) all other configuration outside the control of Hazeltest, which is the configuration of the Hazelcast cluster itself and all other data structures. Basically, even if (a) was done right, the myriad of variables – and their combinations! – for (b) would make the reliability of the evaluation almost a matter of coincidence.
For these reasons, it may not be a very resourceful endeavor to invest time in building reporting and evaluation logic, and focus instead on delivering more test output so organizations can build their tailor-made reporting and evaluation logic on top of that precisely for the use cases they have for their Hazelcast clusters. For Hazeltest, this could mean:
- Yet more elaborate logging (for example, capturing the time certain operations took, and the logging thereof, might be useful)
- Provide more information on the status endpoint
- Instrument code for the collection of metrics to offer them for scraping
Coming back to the simple example made earlier, based on the logging output, an organization might run Hazeltest (load generation) and build a search query for failed map reads in their log analyzing platform (reporting) in order to alert on the query results depending on a certain threshold (evaluation).
Chaos Monkey
So, if load generation is the way to go, why not spice it up a bit? One way for doing so might be what could be referred to as a Chaos Monkey. Basically, the idea is to shut down random Hazelcast members, but do so with varying “difficulty settings” from easiest to hardest. For example:
- Easiest: Shut down one random member in cluster every 15 minutes or so, but do so gracefully
- Hardest: Shut down n(cluster members) * modifier of doom cluster members every, say, 5 minutes, without waiting for graceful shutdown
The Chaos Monkey could run on its own goroutine so it’s independent from the runners of the application, and its actions would influence the Hazelcast cluster, which in turn would impact the actions that the runners perform on the cluster, so given that their logging is sufficiently elaborate and/or Hazeltest provides detailed enough metrics, organizations can monitor the runner output in order to determine if their Hazelcast cluster is resilient to the level of failure created by the Chaos Monkey.
Summary
One may divide the testing process for Hazelcast into three consecutive phases, namely, load generation, reporting, and evaluation. Hazeltest focuses heavily on the load generation aspect and glosses over the other two, which is due to the wildly different uses cases organizations might have for their Hazelcast clusters – Hazeltest could only guess them, but because those use cases define how reporting and evaluation must be set up to produce a reliable result, the application would have to make a lot of assumptions, which would make result correctness more a function of how closely those assumptions happen to be aligned with those specific use cases, rather than the objective behavior of their Hazelcast clusters. Thus, it’s very likely Hazeltest will stay focused on load generation, and provide fine-grained output about what it’s doing so organizations can build their reporting and evaluation on top, tailoring both to their specific needs.
It follows from this that the next implementation steps will improve on the existing load generation by making the generated load more realistic and heterogeneous, and by adding a new feature one might call the “Chaos Monkey”. As a counter to configuration complexity, which increases as new features get added, the application will offer configuration presets, which could also serve as a means of documentation for what runner configuration generates what kind of load.