More Cattle

What’s better than a certain number of RKE cluster nodes? Well, more cluster nodes, of course!
For an upcoming live stream about Hazeltest, the RKE cluster I use needs a bit more juice (a lot more, actually). In the following sections, you’ll see that introducing additional Linux machines as new nodes to an existing RKE cluster is very easy, and you’ll also get acquainted with a cool Kubernetes dashboard called Skooner. Finally, we’re going to use said Hazeltest to put the new nodes to a good test.
If you would like to follow along from here on, you’ll need an active RKE cluster at your disposal. In case this is currently not true for you, but you happen to have a bunch of old machines standing around with a tickle in your fingers to do something useful with them, you can find instructions for how to set them up and use them in an RKE cluster installation over here.
Adding More Nodes
When we last checked on our RKE cluster after its successful setup, it had three nodes in total, one of them also a control plane and Etcd host, which were able to run Hazelcast along with about 45 Hazeltest Pods. So, the cluster.yml file on which we ran the rke up command contained three node entries as well as some cluster-global configuration.
What we have to do next is add more node entries to the list according to the configuration and roles they are supposed to have in the resulting cluster. We could achieve that by running the rke config command again, but this would require typing in the information on all nodes plus the cluster-global configuration because the tool would simply regenerate the cluster.yml file completely from scratch. Thus, the considerably easier and faster way for introducing additional nodes is to just extend said file by adding the new node entries manually. For example (adjust according to your network and requirements):
nodes:
  # ...
  - address: 192.168.8.171
  port: "22"
  internal_address: ""
  role:
    - controlplane
    - worker
    - etcd
  hostname_override: "kube-0"
  user: rke
  docker_socket: /var/run/docker.sock
  ssh_key: ""
  ssh_key_path: ~/.ssh/id_rsa
  ssh_cert: ""
  ssh_cert_path: ""
  labels: {}
  taints: []
  - address: # ...
  # ...
Before you jump ahead now and run rke up on your extended file, please ask yourself how many Pods the new nodes – or all the nodes in your cluster, for that matter – are supposed to run. The reason for this question is that Kubernetes imposes a limit on the number of Pods each node can run – according to the documentation’s Considerations for large clusters page, this limit is 110. In my case, one of the newly introduced nodes is sufficiently well-equipped in terms of its CPU and RAM to run more than 110 Hazeltest Pods (which is also because one Hazeltest Pod has a very modest resource footprint), so without adoption of the node configuration, it would run into the default Pod-per-node limit. Fortunately, Kubernetes makes it easy to increase that limit, and the RKE team were so kind to pass on that simplicity. So, in case the above might become an issue for you, too, you can increase the maximum number of Pods allowed on your cluster’s nodes by adding the max-pods argument to the Kubelet configuration’s extra-args section in the cluster.yml file (you’ll want to scroll down a bit to the services section):
# Before
services:
  # ...
  kubelet:
    image: ""
    extra_args: {}
    # ...

# After
# (Adjust to whatever you need for your cluster)
services:
  # ...
  kubelet:
    image: ""
    extra_args:
      max-pods: 150
    # ...
Another question to ask yourself before running rke up is whether you only added new node entries without re-adjusting the control plane and Etcd roles, or made adjustments to those assignments. In the former case, it will be sufficient to simply run rke up on the extended cluster.yml file again, but in the latter, you might want to tear down the cluster first by executing rke remove and kill all containers that might still be running on the nodes, and only then run rke up to create a completely fresh cluster with the new role assignments. Please also keep in mind that RKE requires certain images to be present on each machine, so in case the machines you would like to introduce as new nodes haven’t previously been used in an RKE cluster, the installer will have to download the images first, in which case the installation process will take considerably longer.
Either way, once the installer has finished, we can check on our new nodes and make sure all of them have achieved readiness. In my case, after having introduces three more nodes, the cluster now consists of six nodes in total, the most well-equipped of which has assumed the control plane and Etcd roles beyond the worker role:
# As always...
$ alias k=kubectl

$ k get node
NAME     STATUS   ROLES                      AGE    VERSION
kube-0   Ready    controlplane,etcd,worker   2d1h   v1.22.7
kube-1   Ready    worker                     2d1h   v1.22.7
kube-2   Ready    worker                     2d1h   v1.22.7
kube-3   Ready    worker                     2d1h   v1.22.7
kube-4   Ready    worker                     2d1h   v1.22.7
kube-5   Ready    worker                     2d1h   v1.22.7
With our shiny new nodes in place, let’s install a dashboard to get a nice overview of the cluster state.
Installing A Dashboard
The dashboard I would like to show you is called Skooner. I have chosen it over the official Kubernetes dashboard because it is more lightweight in terms of the number of objects it requires in the Kubernetes cluster, and because I like its somewhat cleaner-looking and more refined UI. At the end of the day, though, which of the two you use – or whether you prefer yet another one like Kubevious, Headlamp, or Octant – seems to be a matter of taste (unless you have specific requirements). In the following paragraphs as well as in the next section, we’re going to work with Skooner.
The Skooner team have provided a section on how to install the dashboard on their GitHub, which essentially boils down to installing this Yaml file to your cluster. At the time of this writing, though, the file in question does not come with the objects required for authentication to the dashboard (which is probably because Skooner provides multiple options for setting up authentication, so hard-wiring one of them wouldn’t make much sense). If you’re okay with a ServiceAccount as your means for authentication, you may find the following Yaml file helpful, which comes with said ServiceAccount plus a ClusterRoleBinding to grant the former the admin privileges required for logging in to Skooner (if your cluster supports LoadBalancer-type Services, you may want to update the Service definition accordingly):
kind: Deployment
apiVersion: apps/v1
metadata:
  name: skooner
  namespace: kube-system
spec:
  replicas: 1
  selector:
    matchLabels:
      k8s-app: skooner
  template:
    metadata:
      labels:
        k8s-app: skooner
    spec:
      containers:
      - name: skooner
        image: ghcr.io/skooner-k8s/skooner:stable
        ports:
        - containerPort: 4654
        livenessProbe:
          httpGet:
            scheme: HTTP
            path: /
            port: 4654
          initialDelaySeconds: 30
          timeoutSeconds: 30
      nodeSelector:
        'kubernetes.io/os': linux
---
kind: Service
apiVersion: v1
metadata:
  name: skooner
  namespace: kube-system
spec:
  type: NodePort
  ports:
    - port: 80
      targetPort: 4654
  selector:
    k8s-app: skooner
---
apiVersion: v1
kind: ServiceAccount
metadata:
  name: skooner-sa
  namespace: kube-system
---
apiVersion: rbac.authorization.k8s.io/v1
kind: ClusterRoleBinding
metadata:
  name: skooner-sa
  namespace: kube-system
roleRef:
  apiGroup: rbac.authorization.k8s.io
  kind: ClusterRole
  name: cluster-admin
subjects:
- kind: ServiceAccount
  name: skooner-sa
  namespace: kube-system
Applying this file to your cluster should give you something like the following (note that all objects will be created in the kube-system namespace):
$ k apply -f dashboard-skooner.yaml
deployment.apps/skooner created
service/skooner created
serviceaccount/skooner-sa created
clusterrolebinding.rbac.authorization.k8s.io/skooner-sa created
To access and log in to the dashboard, you’ll need the NodePort your cluster has assigned to the skooner Service (in case you sticked with the NodePort-type Service), as well as the token generated for the skooner-sa ServiceAccount. Let’s retrieve both (output might well look different for you):
# Retrieve NodePort
$ k -n kube-system get svc skooner -o jsonpath="{.spec.ports[0].nodePort}"
31150

# Retrieve token from Secret (this is a bit ugly because since the secret is system-generated
# and does not carry any labels, it can't be selected directly)
$ k -n kube-system get secret -o custom-columns="NAME:.metadata.name" --no-headers \
| grep skooner \
| xargs kubectl -n kube-system get secret -o jsonpath="{.data.token}" \
| base64 -d && echo
<very long string>
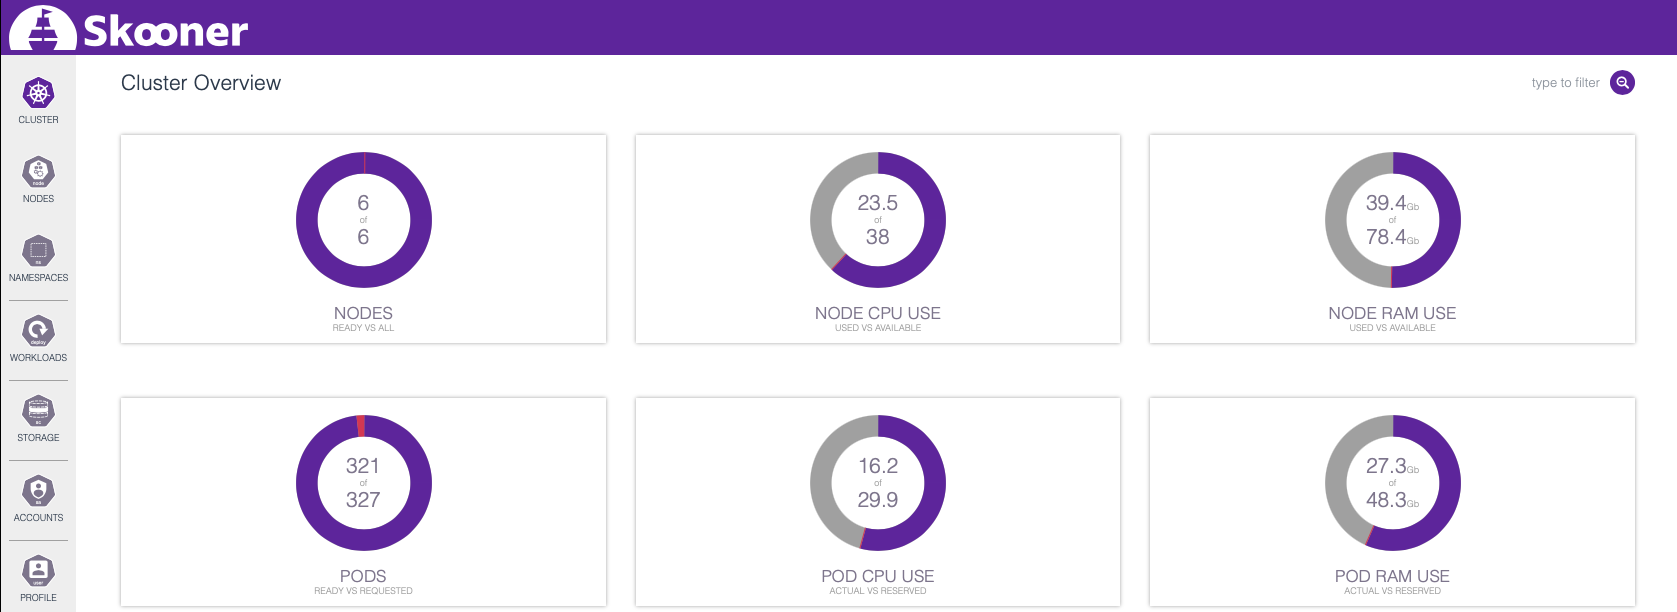
Once you’ve pointed your browser to <one of your nodes>:31150 (or whatever port the system assigned in your case) and have provided whatever value you got for <very long string> in the input form, you should be presented with something akin to the following:
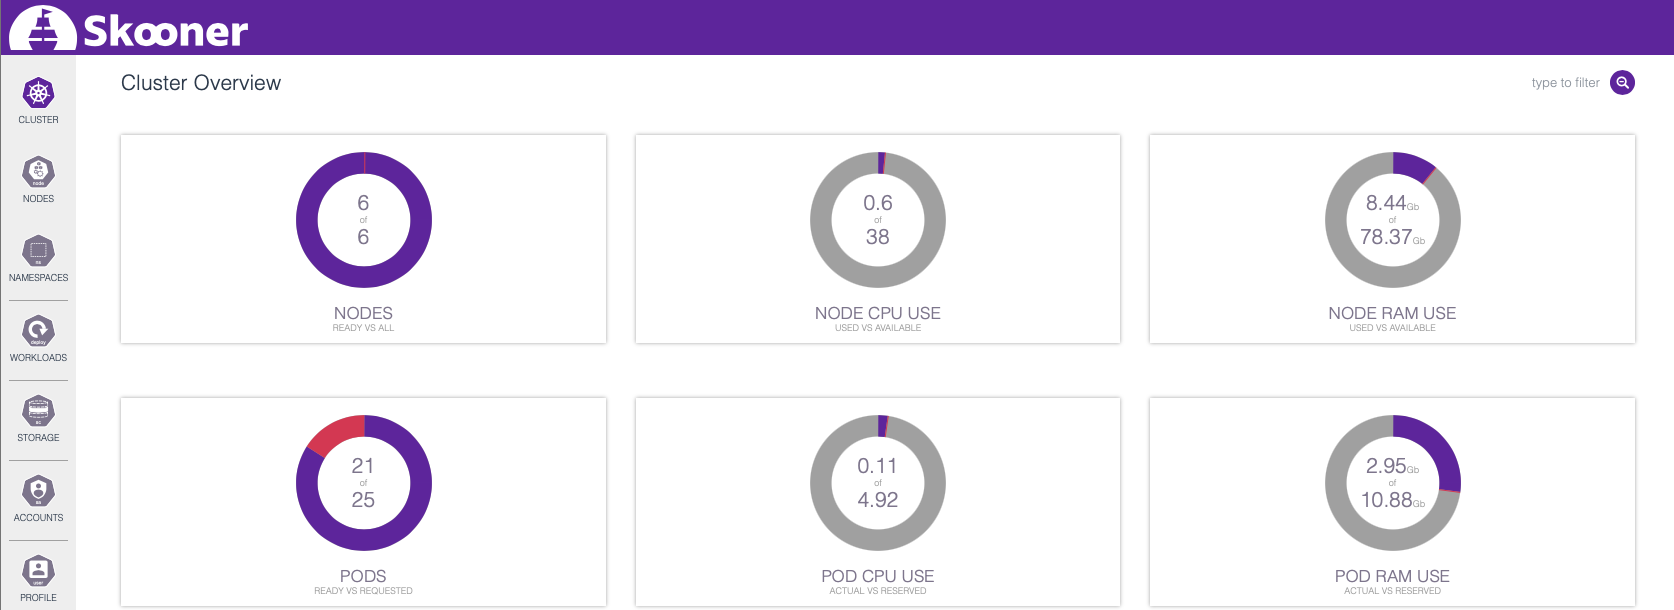
, … which provides a highly condensed view on the health and state of your cluster.
In the upcoming section, we’re going to deploy both a Hazelcast cluster and Hazeltest instances to generate some load on the former, and the cluster overview, as well as the content accessible through the Workloads tab on the dashboard’s left-hand side, will provide a convenient live view on what’s happening in our cluster.
300: This Is… A Lot Of Pods
… , and while not of Spartan origin, they will nonetheless make a lot of noise. To give those newly added nodes something to chew on, we will deploy Hazelcast to the cluster and then spawn 300 Hazeltest Pods for load generation. Remember, the previous iteration of the RKE cluster could host roughly 45 of the latter, which imposed a limit both on the number of maps to be created and worked on in Hazelcast and, in particular, the number of clients the Hazelcast cluster had to manage. Being able to scale up Hazeltest thus provides a lot more versatility for the load generation scenarios to be launched against the Hazelcast cluster under test.
Without further ado, let’s start by cloning the Hazeltest repo and examine the Helm charts available there. At the time of this writing, you’ll find two, one for the Hazelcast cluster and another one for deploying some Hazeltest Pods. We’ll start by deploying Hazelcast (the following commands assume you’re in the resources/charts directory):
$ helm upgrade --install hazelcastwithmancenter ./hazelcastwithmancenter --namespace=hazelcastplatform --create-namespace
While we wait for the Hazelcast Pods to achieve readiness, we can adjust Hazeltest’s state description in its Helm chart to create 300 replicas rather than only 1:
# Command for Linux
$ sed -i 's/replicaCount:\ 1/replicaCount:\ 300/g' hazeltest/values.yaml

# Command for MacOS
$ sed -i '' 's/replicaCount:\ 1/replicaCount:\ 300/g' hazeltest/values.yaml

# Check result
$ head -1 hazeltest/values.yaml
replicaCount: 300
Once at least one Hazelcast Pod has achieved readiness, we can install the Hazeltest chart:
$ helm upgrade --install hazeltest ./hazeltest --namespace=hazelcastplatform
Let’s head over to Skooner and check on the cluster. If you’re on the Workloads tab and filter for hazeltest, you should see something similar to this:
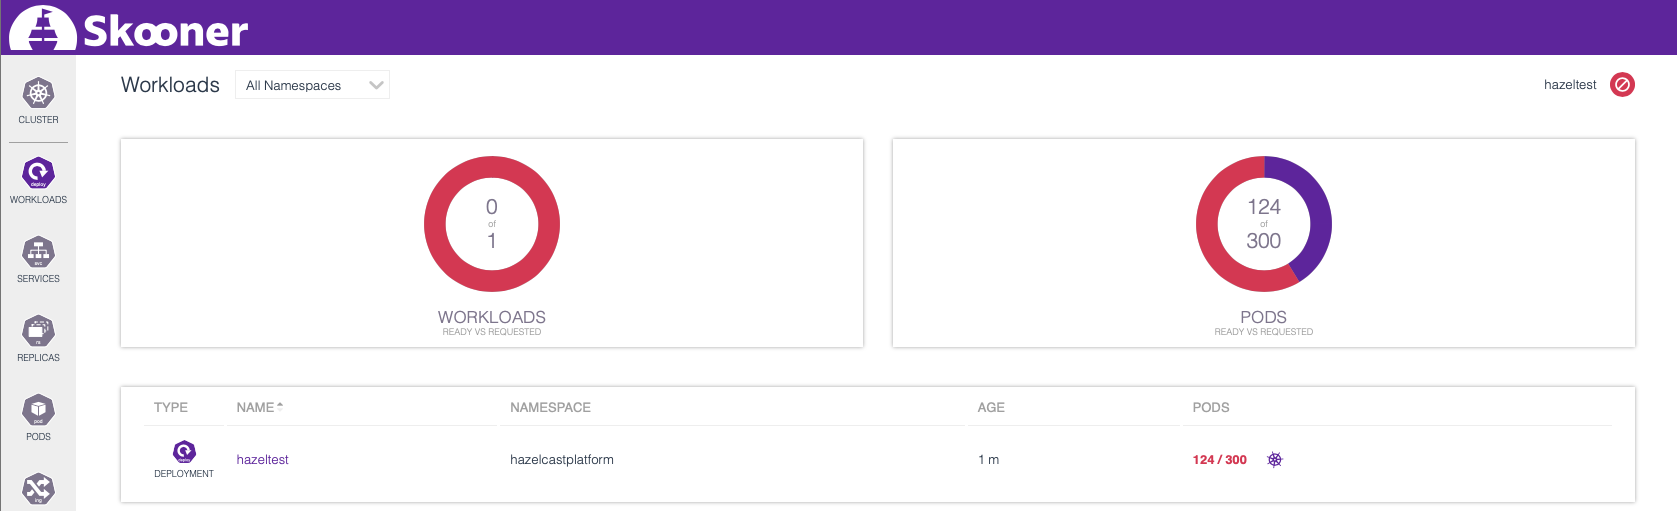
This is the cluster’s worker nodes step by step accommodating the requested Pods, and in the cluster overview, we can see how the cluster resource usage gradually increases (the lower-left panel displays more than 300 requested Pods because the panel is not exclusive to one workload):
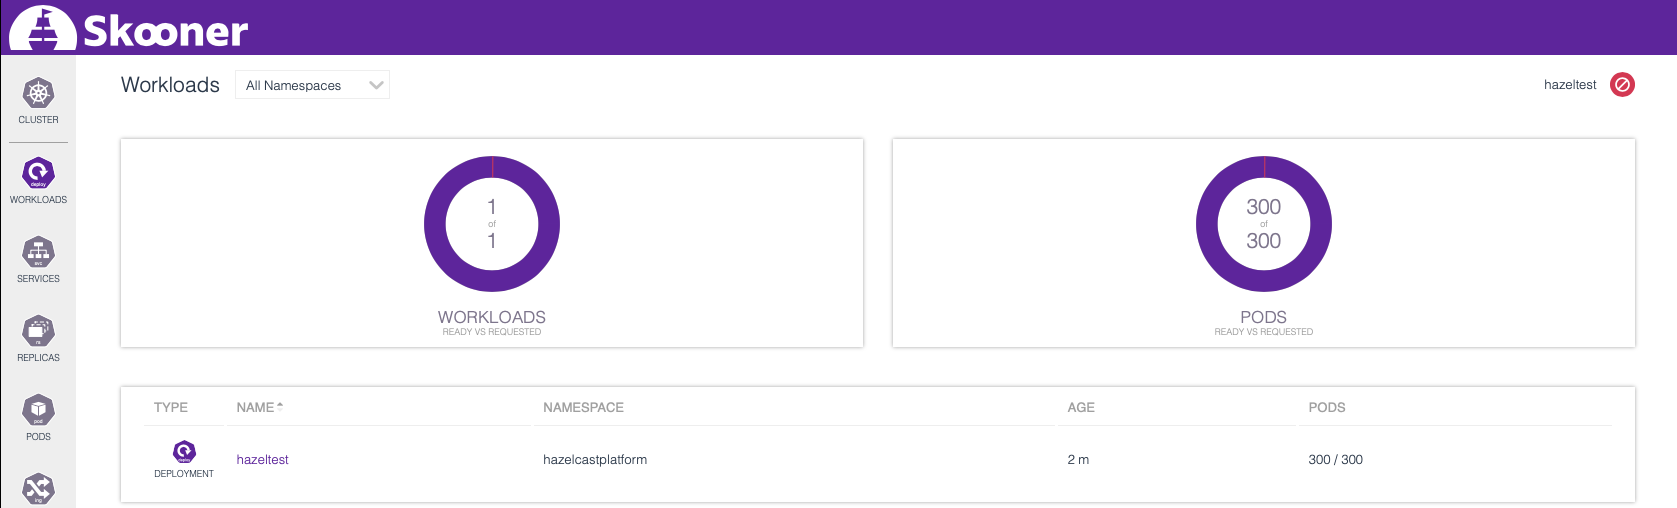
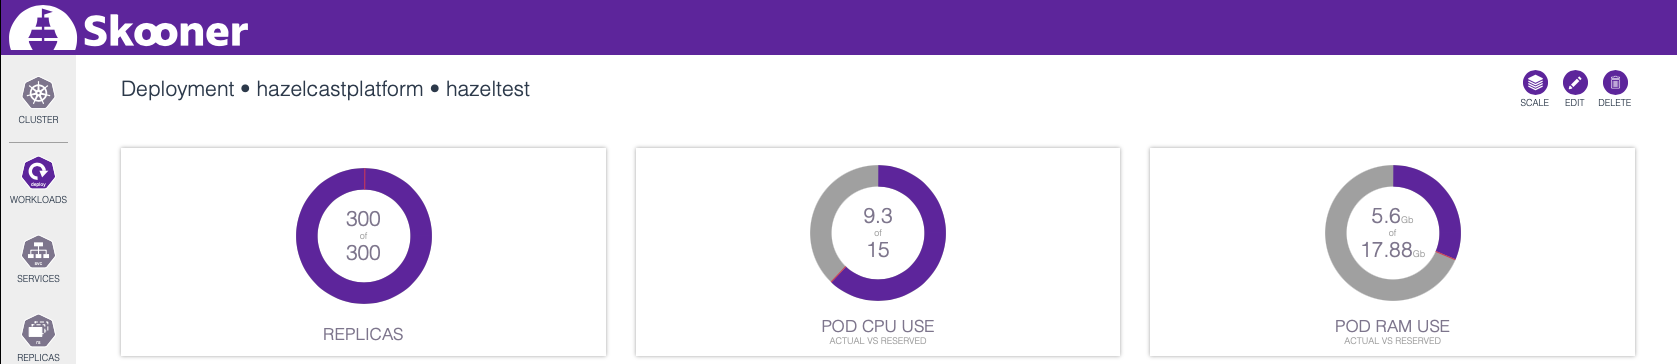
If you’ve done this on your own RKE cluster sufficiently well-equipped with CPU and RAM to accommodate all the Hazeltest Pods, you should eventually see in the Workloads tab how all Pods have become ready:
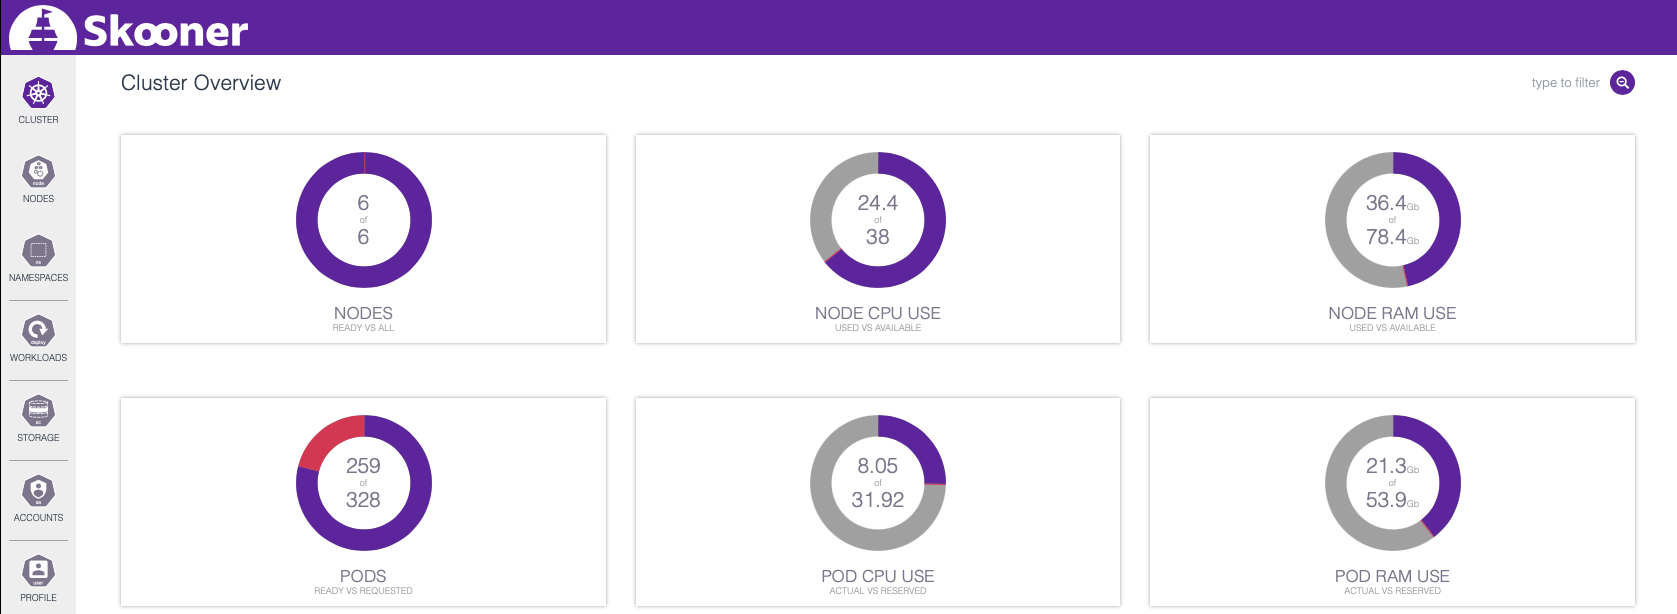
Let’s check the cluster overview again and see how deploying those 300 Hazeltest Pods has impacted resource usage:
As you can see, there is still some room available both in terms of CPU and RAM for some additional Hazeltest Pods. Just for the sake of having tried the feature, head over to the detail view for the Hazeltest workload…
… and use the SCALE button in the upper-right corner. How many Pods can your cluster accommodate? With Hazelcast’s and Hazeltest’s resource configuration at the time of this writing, mine caps out at 426:
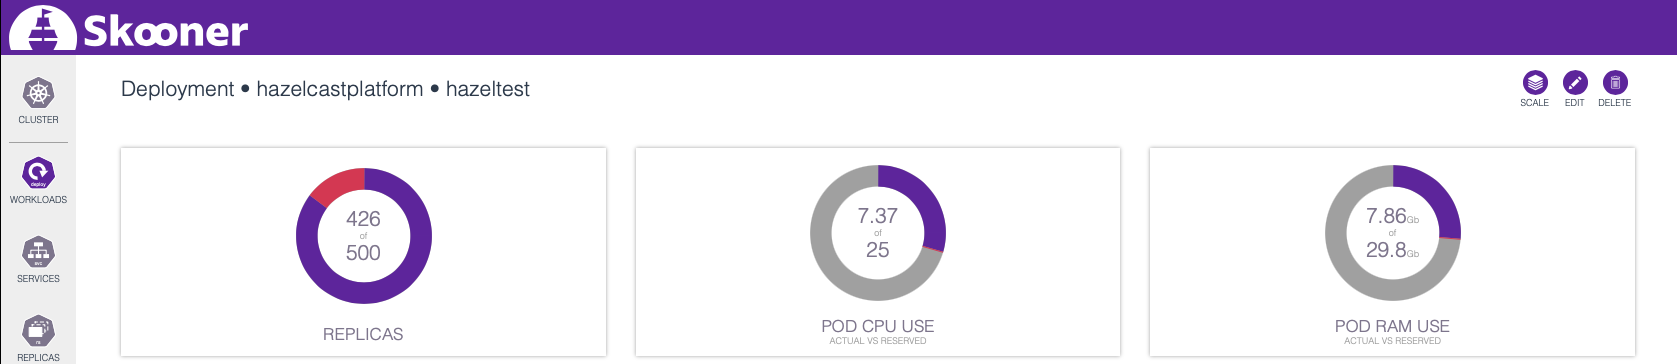
426 Pods – and 300, for that matter – should easily be sufficient to create a plethora of different load scenarios for the Hazelcast cluster under test, though, so I’m perfectly happy with those results.
Cleaning Up
You can clean up the cluster by uninstalling Hazeltest and Hazelcast like so:
$ helm uninstall hazeltest --namespace=hazelcastplatform
release "hazeltest" uninstalled

$ helm uninstall hazelcastwithmancenter --namespace=hazelcastplatform
release "hazelcastwithmancenter" uninstalled
Summary
Thanks to RKE awesomeness, introducing additional nodes to an existing RKE cluster – or recreating the cluster from scratch in case of migrating the control plane and Etcd roles and adding Kubelet flags – can be done quickly and easily. Dashboards such as Skooner can be used to get a nice live view on the resource usage both of the cluster as a whole and the workloads it is running.
Having the possibility to spawn a much higher number of Hazeltest Pods than previously introduces more versatility to the set of load scenarios those Hazeltest instances can launch against the Hazelcast cluster under test, and the first great opportunity for demonstrating this will be an upcoming live stream on how to use Hazeltest.